Brought to you and to the world by
$250 adspace
180-day display
$1.38/day
$250 adspace
180-day display
$1.38/day
$250 adspace
180-day display
$1.38/day
Meet Barbara Boldt
Executive Communication Skills Coach
https://www.boldtglobal.com/free-consultation 45-minute free consult
We are designing I Q to be helpful to people who are "visual’ adspace $100 (small ad) $250 (large)100 day display animated ads will work great for you in IQ get a FREE adlink; join GlobalPressClub (click/learn) ED (+1)619.787.3100 text or email publisher@globalbusiness.media
Editor, Ed Cohen
v/txt (+1) 619 787 3100
publisher@globalbusiness.media
Allow me to host you in a 1:1 GLOBAL PR interview; me + YOU + your brand for about 20 minutes on pre-agreed topics. You receive media prep/coaching.
Low fee $195 = high value. You receive the finished program-link for your own use forever. SPECIAL OFFER, buy a 3-edition package @ $250.
I display each program 12months+ on our active youtubechannel and also 4months on globaltvtalkshow.com + distribute it across our networks including youtube, LinkedIn, FB, instagram. Audience Reach will exceed 100,000 across the days, weeks and months following the original production date.
YOUR TOTAL SATISFACTION with our video production quality nicely presenting you/your brand: 100% money-back guarantee on our quality production/services.
And we give you a THANK YOU GIFT for being our customer:
I give you free ad space (Small adlink 180-days) on IQ + GLOBALPR, the new online magazine.
… yes, let’s discuss things
1:1
with
Patricia Tavares
BRAZIL TALKS
Great People Management
1:1
Tatyana St. Germain
DAVID EDICK Jr
on
WORLD AFFAIRS
geo-political
economics
Zurich-based
ANGIE W
on
BECOMING
A
LEADER
Subscribe/join us and thrive from the new connex every month and the nonstop GLOBAL PR services, strategy and tactics all members will learn during their length of subscription membership (cost $1.88/day for an annual subscription membership) and you decide how many days you want… select the 90 day sprint, or do the 180 days or take 365 days or 500 or 1000 days.
All members receive 100% full-service for the duration of their selected plan. Here’s the full info (click) … and note, all members receive our TOTAL SATISFACTION GUARANTEE, yes, 100% money-back guarantee on our Public Relations (PR) services/product quality +delivery.
Come join me… (+1)6197873100 or email me publisher@globalbusiness.media
V A R I E T Y
for our diverse audience
from across time/space,
from across borders/cultures,
from across industries/silos
people … places … topics
2023 https://youtu.be/oqwUPhuzG2U
Rob Pianka, Global Agility https://youtu.be/MJQQrqo5FK4
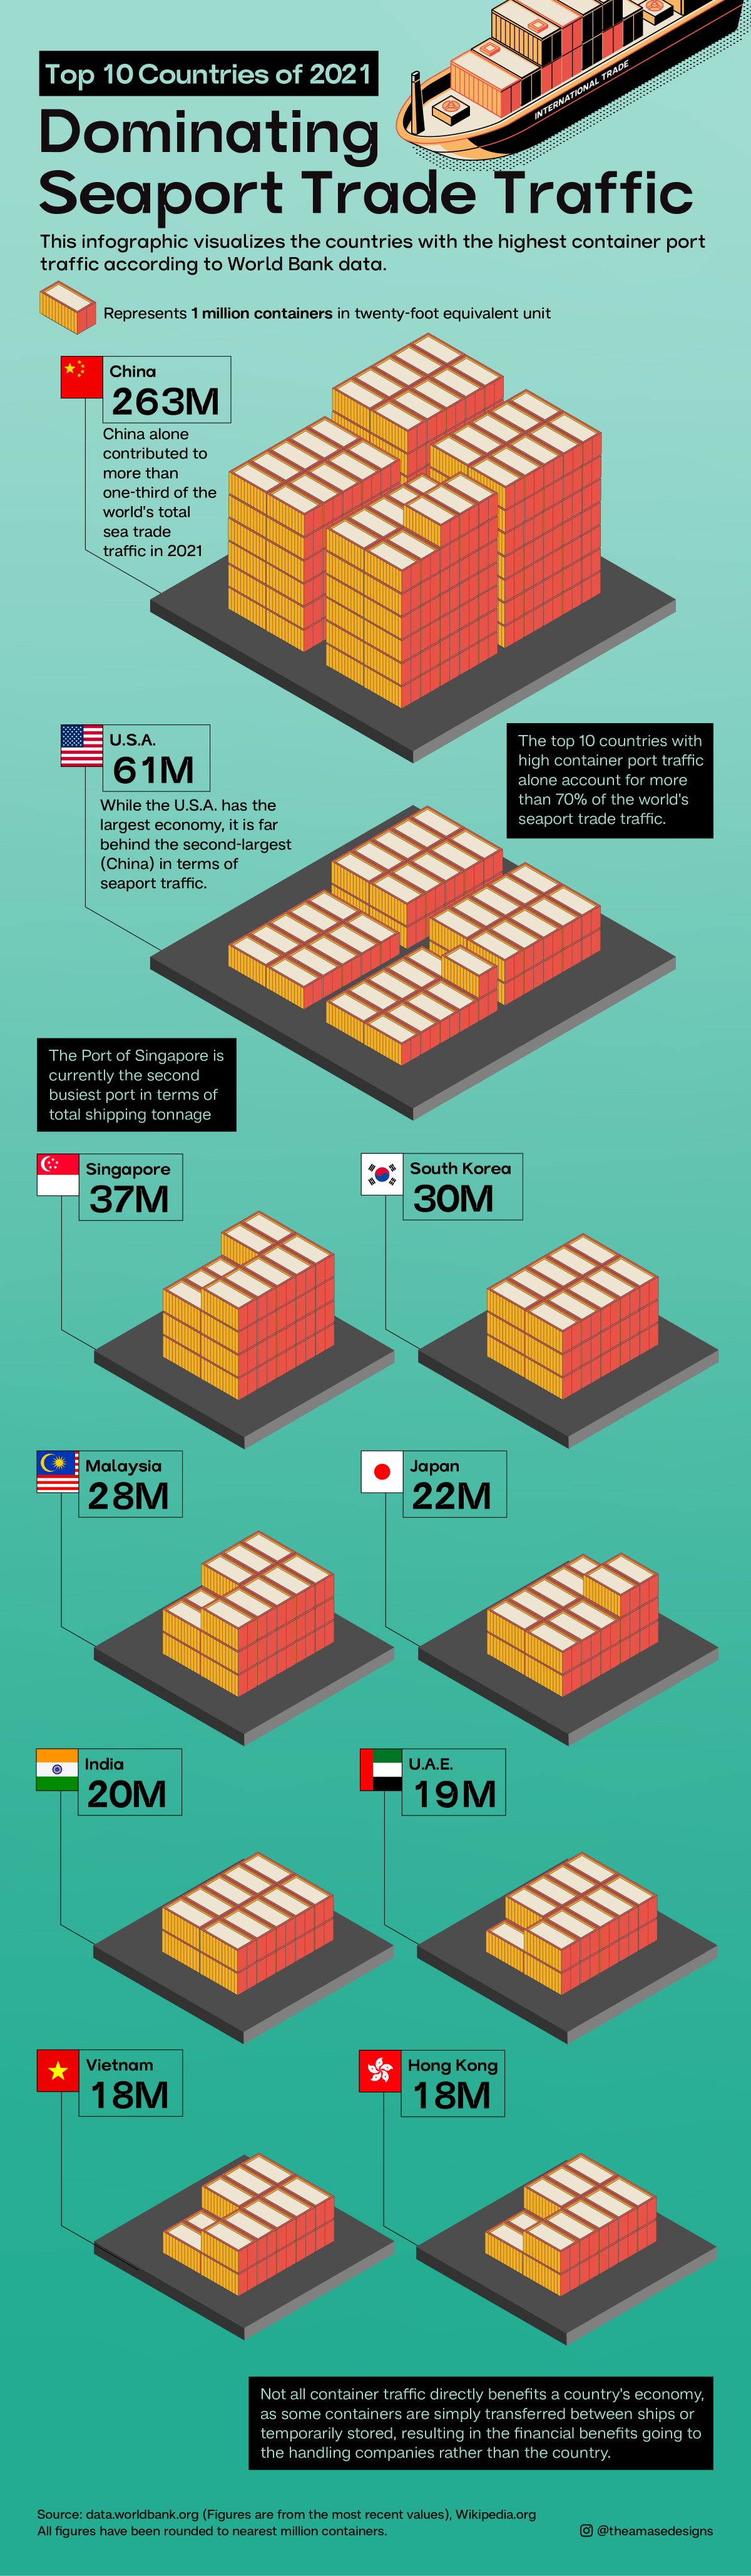
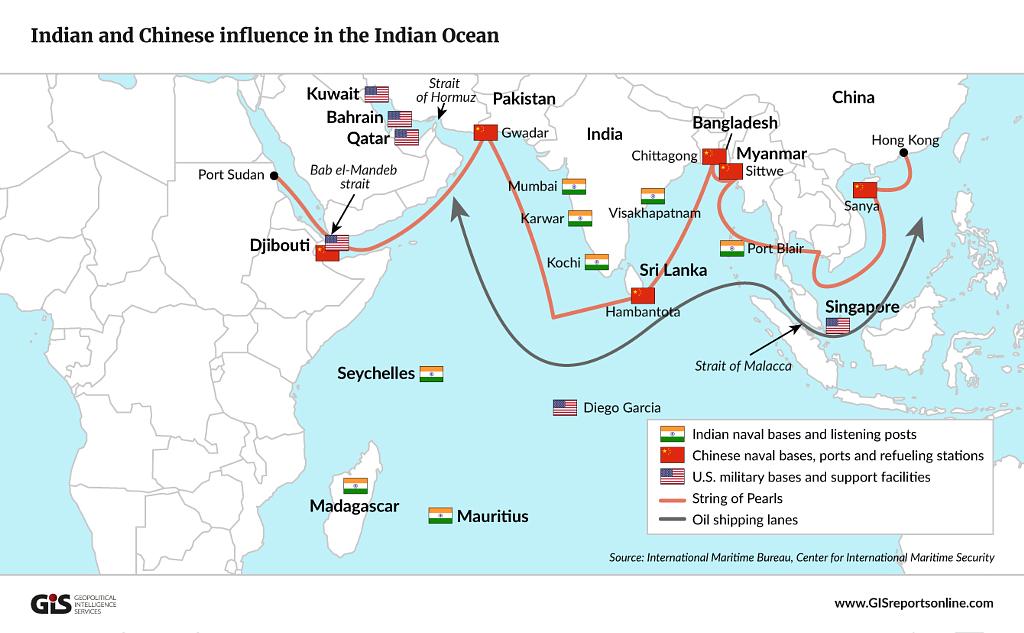
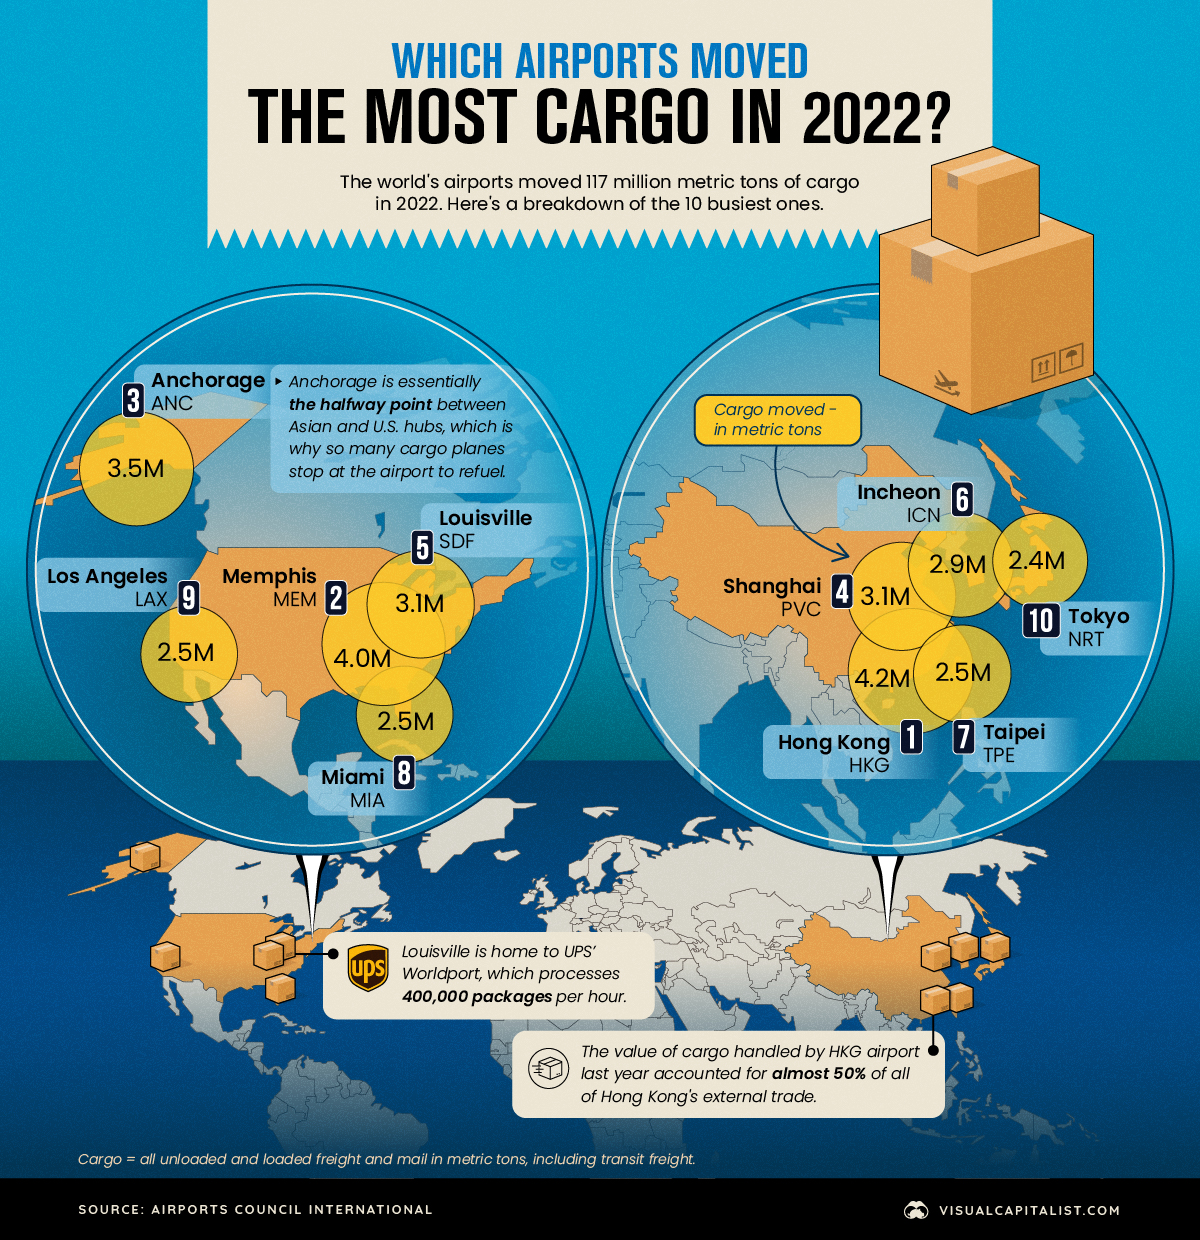
International Shipping,1:1 with Alex Talbot https://youtu.be/IFvMjmiA2Ks
Larry Kruger CustomizedMoving.com https://youtu.be/2eOZvMteqZE
Dr Natalie https://youtu.be/iNvjbMZJhnM;
pandemic of LOVE https://youtu.be/U5TdRRq4o64;
James Moss, London/NewYork, mobility-tec absoluterelo.com https://youtu.be/1MPIn60UnNo
talent mobility https://youtu.be/juJWTJoTM6Y;
power of women https://youtu.be/scHq-lN6IAM;
London now? https://youtu.be/HhdO9AblUpU;
I got out of Moscow https://youtu.be/xvbveJZmTUM;
International Lifestyles https://youtu.be/cS_DNvCvveQ;
COMMUNICATORS https://youtu.be/rRDzeQUnyEM;
me…sexist ? https://youtu.be/hWzC0W0FoZs
From HR Operating Model to HR Operating System—This article by Josh Bersin shares why HR needs to shift from a series of Centers of Excellence and Service Delivery teams to an integrated operating system.
While the article includes several insights for making this shift, a few points include:
(1) HR needs to focus on “problems to be solved” rather than a set of services, offerings, or programs.
(2) Given that the solutions and opportunities to solve these problems are more complex, no COE (e.g., recruiting, talent management, learning, & development, etc.) alone can solve these problems.
(3) Instead, each HR area needs to be interconnected in a solution-oriented, real-time way. “Full stack” HR professionals (like full-stack engineers)— who are deep in one domain but have wide expertise in the other domains of HR—enable this operating system.
As HR leaders increasingly shift their teams towards this way of operating, the article includes 10 transitions to consider, such as:
𝐅𝐑𝐎𝐌: “HR programs that take quarters or years to design and implement, and roll out as large change management programs”
𝐓𝐎: “HR programs run by “product managers’ with regular roadmap updates, driven by ‘change agility, not big bang rollouts.”
Which of the 10 shifts is your HR organization making or planning to make? What barriers do you anticipate? How will you overcome them?
Access the article via issue 165 of the Talent Edge Weekly newsletter https://lnkd.in/em4TSiA7
Well, I’ll be a bit of a devil’s advocate. Bersin’s article mentions centers of excellence and areas of service delivery. It does not mention the HRBP, which happens to be rather pertinent to the issue being discussed. The role of the HRBP was always to be the integrator/connector of HR services to solve the business issue at hand. So a talent gap could be filled by talent acquisition plus talent development plus, perhaps, contract talent – plus the org design requirements in support. If this hasn’t happened I would suggest looking at the HRBP skills/ role, including the nature of their relationship to their client, before worrying about changing from a model to a system.
Global Happiness, by Country
Global happiness currently averages out to 5.5 out of 10, a decrease of 0.1 from last year. Below is a look at every country’s score:
Note: Scores have been rounded to the first decimal place.
European countries make up the bulk of the top 10, with Israel (#4) and New Zealand (#10) also making it into the top ranks. Finland sits at the very top of the ranking for the sixth year in a row.
Now let’s look at the world’s happiest countries on a more regional basis.
North America
Current Mood: Happy (6.3)
North America’s happiness score averages out to 6.3/10. The happiest country in the region is Canada, slightly beating out the United States. However, the scores of both countries have actually decreased from last year. It’s difficult to pinpoint why citizens feel less satisfied, but inflation, economic uncertainty, and many other factors could play a role.
The only countries to see improvement in North America were Nicaragua and Jamaica. Although a more recent development, many Jamaicans could be experiencing even more happiness in the near future, with a recent announcement of plans to increase the minimum wage by 44%.
South America
Current Mood: Content (5.8)
South America’s average score is 5.8. Although Venezuela is the continent’s least happy country, its score actually improved from 4.9 to 5.2. That said, the ongoing humanitarian and economic crisis is not likely to instill much hope into the average Venezuelan. Over 6.8 million people have fled the struggling nation since 2014.
The two countries in the region with decreased scores were Brazil and Colombia, where citizens have reported feeling worse compared to the year before.
Europe
Current Mood: Happy (6.4)
Europe has some of the world’s happiest countries, with an average regional score of 6.4. Nordic countries like Finland, Sweden, and Iceland repeatedly report high scores, meaning people in these countries feel extremely satisfied with their lives.
Despite fending off an invasion, Ukrainians saw no diminishment of their happiness year-over-year, and many are feeling resilient and purposeful in their fight for freedom. Interestingly, Russia’s score actually increased slightly compared to last year, going from 5.5 to 5.7.
East Asia and Oceania
Current Mood: Neutral (5.6)
East Asia and Oceania’s collective average is 5.6. Oceania alone, however, would have the highest regional score in the world, at 7.1.
Bucking conventional wisdom—at least in the West—China has seen a noteworthy bump (+0.6) in its score in recent years. Across the strait, Taiwan records the second highest score in East Asia, after Singapore.
India once again has the lowest happiness score in its region. The country’s score has dropped -0.7 over the past decade.
Central Asia and The Middle East
Current Mood: It’s Complicated (5.2)
The average score in the Middle East and Central Asia is 5.2, and the array of happiness scores is wider than in any other region.
Afghanistan is the world’s least happy country, with citizens having reported extremely low levels of life satisfaction. Since the Taliban takeover, life has become objectively worse for Afghans, particularly women.
There is a lot of conflict in the region. Citizens of Armenia face particular tension with neighboring Azerbaijan, whose score was not recorded for this year. Conflicts in the Nagorno-Karabakh region have led to hundreds of deaths since 2020 and cause daily struggle for those who live in the disputed territory. Iran is still under economic sanctions and faces ongoing tensions with the U.S. and Israel. Some countries, like Syria and Yemen, are so destabilized that no data is available.
Still, there are bright spots as well. Israel has one of the world’s happiest countries with a top 10 score this year, and Saudi Arabia and the UAE have scores on par with many European countries.
Africa
Current Mood: Unhappy (4.4)
The least happy region, Africa, averages out to a score of 4.4, and there is a lot of regional variation.
The highest score in Africa goes to the island nation of Mauritius. In addition to the country’s natural beauty and stability, there is growing economic opportunity. Mauritius is classified as an upper-middle-income country by World Bank, and is one of the fastest growing high-income markets in the world.
Sierra Leone has the lowest score of African countries that were included in the index, followed by Zimbabwe and the Democratic Republic of the Congo. It’s worth noting, there are a few data gaps in the region, including Burundi, which is currently the poorest country in the world.
Where does this data come from?
Source: The World Happiness Report which leverages data from the Gallup World Poll.
Methodology: A nationally representative group of approximately 1,000 people is asked a series of questions relating to their life satisfaction, as well as positive and negative emotions they are experiencing. The life evaluation question is based on the Cantril ladder, wherein the top of the ladder represents the best possible life for a person (a score of 10/10) and on the flipside, the worst possible life (scored as 0/10). The main takeaway is that the scores result from self-reported answers by citizens of each of these countries. The results received a confidence interval of 95%, meaning that there is a 95% chance that the answers and population surveyed represent the average. As well, scores are averaged over the past three years in order to increase the sample size of respondents in each country.
Criticisms: Critics of the World Happiness Report point out that survey questions measure satisfaction with socioeconomic conditions as opposed to individual emotional happiness. As well, there are myriad cultural differences around the world that influence how people think about happiness and life satisfaction. Finally, there can be big differences in life satisfaction between groups within a country, which are averaged out even in a nationally representative group. The report does acknowledge inequality as a factor by measuring the “gap” between the most and least happy halves of each country.
Saudi Arabia’s Trade With China Surpasses the West
Over the past two decades, the economic presence of China has been growing significantly around the world.
The country has already surpassed the U.S. as the largest trading partner of developed nations such as Japan and the European Union.
But the world’s second largest economy is making significant inroads in the Middle East as well. This graphic by Ehsan Soltani uses data from the World Trade Organization (WTO) to chart Saudi Arabia’s trading history with the EU, the U.S, and China.
Evolving Trade Relations
With China’s imports from and exports to Saudi Arabia now exceeding the major oil-producing country’s combined trade with the U.S. and the EU, China has become Saudi Arabia’s dominant trading partner.
Back in 2001, Saudi Arabia’s trade with China was a mere fraction—just one-tenth—of its combined trade with the EU and United States. While the total value of trade was modest at this time, it’s been increasing consistently almost every year since.
By the year 2011, China had surpassed the U.S. for the first time in bilateral trade value with Saudi Arabia. Then by 2018, trade between China and Saudi Arabia surpassed the Middle-Eastern country’s trade with the entire EU.
Fast forward to today, and China has emerged as a larger trading partner with Saudi Arabia than the rest of the West combined.
The Perfect Match?
China’s status as Saudi Arabia’s biggest trading partner makes sense considering its recent economic growth and focus.
China is the largest buyer of crude oil in the world, and it buys more from the Saudi Arabia than anywhere else. Almost half of the $87.3 billion bilateral trade between the two nations in 2021 was comprised of China’s crude oil imports. This accounted for 77% of China’s total imports from Saudi Arabia, which also included goods like plastic—a petroleum product.
Saudi Arabia, meanwhile, imported over $30 billion worth of goods including technological equipment, telephones, and light fixtures.

Mapped: Europe’s Biggest Sources of Electricity by Country
Energy and electricity supply have become vital for nearly every European nation over the past year, as the region shifts away from its dependence on Russian fuel imports.
While many countries have been making progress in their energy transition away from fossil fuels, nearly half of European countries are still dependent on them as their primary source of electricity generation.
This graphic maps out European countries by their top source of electricity generation using data from Electricity Maps and the IEA, along with a breakdown of the EU’s overall electricity generation by source in 2021.
Europe’s Electricity Generation by Energy Source
Europe has been steadily transitioning towards renewable sources of energy for their electricity generation, making considerable progress over the last decade.
In 2011, fossil fuels (oil, natural gas, and coal) made up 49% of the EU’s electricity production while renewable energy sources only made up 18%. A decade later, renewable energy sources are coming close to equaling fossil fuels, with renewables making up 32% of the EU’s electricity generation compared to fossil fuels’ 36% in 2021.
Source | EU Electricity Generation Share (2011) | EU Electricity Generation Share (2021) |
---|---|---|
Nuclear | 29% | 25% |
Coal | 25% | 14% |
Natural Gas | 19% | 20% |
Hydropower | 10% | 13% |
Wind | 6% | 13% |
Oil | 5% | 2% |
Solar | 2% | 6% |
Biofuel | 4% | 5% |
Other | n/a | 2% |
The expansion of wind and solar generation have been the primary drivers in this shift towards renewables, going from only generating 8% of the EU’s electricity in 2011 all the way to 19% in 2021. While this might still seem small, the EU’s share of wind and solar electricity generation is tied for first alongside Oceania when compared to other regions around the world.
While hydropower doesn’t make up as big of a share as other sources, it’s the most common primary source of electricity generation in Europe, playing an important role in providing renewable energy.
Nuclear energy is the largest single source of electricity generation in the EU and across Europe despite its decline over the past couple of decades. Back in 2001, nuclear energy made up one-third (33%) of the EU’s electricity generation, and in the following 20 years fell down to 25%.
The Primary Electricity Sources of Europe’s Major Nations
When looking at individual nations, the majority of Europe’s largest countries have fossil fuels as their largest primary single source of electricity.
Germany remains heavily reliant on coal power, which from 2017 to 2021 generated 31% of the nation’s electricity. Despite the dependence on the carbon intensive fossil fuel, wind and solar energy generation together made up more of Germany’s electricity generation at 33% (23% for wind and 10% for solar).
France is Europe’s largest economy that primarily relies on nuclear power, with nuclear power making up more than half of the country’s electricity production.
Italy, the UK, and the Netherlands are all primarily natural gas powered when it comes to their electricity generation from 2017 to 2021. While Italy is the most reliant of the three at 42% of electricity generated by natural gas, the Netherlands (40%), and the UK (38%) aren’t too far off.
Spain is an outlier among major European nations and a success story in a transition towards renewable energy sources. While in the period from 2017-2021 the country was primarily dependent on natural gas (29%), in 2022 natural gas’ contribution to electricity generation fell to 14% as wind rose up to become the primary electricity generator with a 32% share.
Accelerating the EU’s Energy Transition
Since Russia’s invasion of Ukraine, energy independence in the EU has become of utmost importance, and countries have taken the opportunity to accelerate their transition towards renewable energy sources.
A new report from Ember highlights how the transition made considerable progress in 2022, with solar and wind power (22%) overtaking natural gas (20%) in electricity generation for the first time ever.
While 2022 did see an increase in fossil fuel electricity generation for the EU, Ember is expecting it to decline in 2023 by as much as 20%. If the EU can sustain this accelerated shift away from fossil fuels, this map of primary energy sources of electricity generation could feature many more renewable and low-carbon energy sources in the near future.

The Scale of Global Fossil Fuel Production
Fossil fuels have been our predominant source of energy for over a century, and the world still extracts and consumes a colossal amount of coal, oil, and gas every year.
This infographic visualizes the volume of global fossil fuel production in 2021 using data from BP’s Statistical Review of World Energy.
The Facts on Fossil Fuels
In 2021, the world produced around 8 billion tonnes of coal, 4 billion tonnes of oil, and over 4 trillion cubic meters of natural gas.
Most of the coal is used to generate electricity for our homes and offices and has a key role in steel production. Similarly, natural gas is a large source of electricity and heat for industries and buildings. Oil is primarily used by the transportation sector, in addition to petrochemical manufacturing, heating, and other end uses.
Here’s a full breakdown of coal, oil, and gas production by country in 2021.
Coal Production
If all the coal produced in 2021 were arranged in a cube, it would measure 2,141 meters (2.1km) on each side—more than 2.5 times the height of the world’s tallest building.
China produced 50% or more than four billion tonnes of the world’s coal in 2021. It’s also the largest consumer of coal, accounting for 54% of coal consumption in 2021.
Rank | Country | 2021 Coal Production (million tonnes) |
% of Total |
---|---|---|---|
#1 | China | 4,126.0 | 50% |
#2 | India | 811.3 | 10% |
#3 | Indonesia | 614.0 | 8% |
#4 | U.S. | 524.4 | 6% |
#5 | Australia | 478.6 | 6% |
#6 | Russia | 433.7 | 5% |
#7 | South Africa | 234.5 | 3% |
#8 | Germany | 126.0 | 2% |
#9 | Kazakhstan | 115.7 | 1% |
#10 | Poland | 107.6 | 1% |
Other | 600.9 | 7% | |
Total | 8,172.6 | 100% |
India is both the second largest producer and consumer of coal. Meanwhile, Indonesia is the world’s largest coal exporter, followed by Australia.
In the West, U.S. coal production was down 47% as compared to 2011 levels, and the descent is likely to continue with the clean energy transition.
Oil Production
In 2021, the United States, Russia, and Saudi Arabia were the three largest crude oil producers, respectively.
Rank | Country | 2021 Oil Production (million tonnes) |
% of Total |
---|---|---|---|
#1 | U.S. | 711.1 | 17% |
#2 | Russia | 536.4 | 13% |
#3 | Saudi Arabia | 515.0 | 12% |
#4 | Canada | 267.1 | 6% |
#5 | Iraq | 200.8 | 5% |
#6 | China | 198.9 | 5% |
#7 | Iran | 167.7 | 4% |
#8 | UAE | 164.4 | 4% |
#9 | Brazil | 156.8 | 4% |
#10 | Kuwait | 131.1 | 3% |
Other | 1172.0 | 28% | |
Total | 4221.4 | 100% |
OPEC countries, including Saudi Arabia, made up the largest share of production at 35% or 1.5 billion tonnes of oil.
U.S. oil production has seen significant growth since 2010. In 2021, the U.S. extracted 711 million tonnes of oil, more than double the 333 million tonnes produced in 2010.
Natural Gas Production
The world produced 4,036 billion cubic meters of natural gas in 2021. The above graphic converts that into an equivalent of seven billion cubic meters of liquefied natural gas (LNG) to visualize it on the same scale as oil and gas.
Here are the top 10 producers of natural gas in 2021:
Rank | Country | 2021 Natural Gas Production (billion m3) |
% of Total |
---|---|---|---|
#1 | U.S. | 934.2 | 23% |
#2 | Russia | 701.7 | 17% |
#3 | Iran | 256.7 | 6% |
#4 | China | 209.2 | 5% |
#5 | Qatar | 177.0 | 4% |
#6 | Canada | 172.3 | 4% |
#7 | Australia | 147.2 | 4% |
#8 | Saudi Arabia | 117.3 | 3% |
#9 | Norway | 114.3 | 3% |
#10 | Algeria | 100.8 | 2% |
Other | 1106.3 | 27% | |
Total | 4,036.9 | 100% |
The U.S. was the largest producer, with Texas and Pennsylvania accounting for 47% of its gas production. The U.S. electric power and industrial sectors account for around one-third of domestic natural gas consumption.
Russia, the next-largest producer, was the biggest exporter of gas in 2021. It exported an estimated 210 billion cubic meters of natural gas via pipelines to Europe and China. Around 80% of Russian natural gas comes from operations in the Arctic region.
Steven Howard + Ken Somers
Talent
Masterminds
Immigration
Attorney
US RELOCATIONS establishing new “life”, growth/expansion, opportunity.
IMPACT FROM “CLIMATE CHANGE” ??
QUESTION: How will local governments manage ??
-
SOURCE OF THIS ARTICLE: axios
source
EXECUTIVE INTERVIEWS… our specialty product.
See for yourself globaltvtalkshow.com
CONTACT me to discuss various options… all good.
Ed Cohen, Product Developer/Publisher/Broadcaster
voice/text (+1)619.787.3100 or email publisher@globalbusiness.media
Multi-industry, Multi-scale, Multi-geography.