
 Oil
Oil
vs
Top 10 Metals
While the global economy relies on many commodities, none come close to the massive scale of the oil market.
Besides being the primary energy source for transportation, oil is a key raw material for numerous other industries like plastics, fertilizers, cosmetics, and medicine. As a result, the global physical oil market is astronomical in size and has a significant economic and geopolitical influence, with a few countries dominating global oil production.
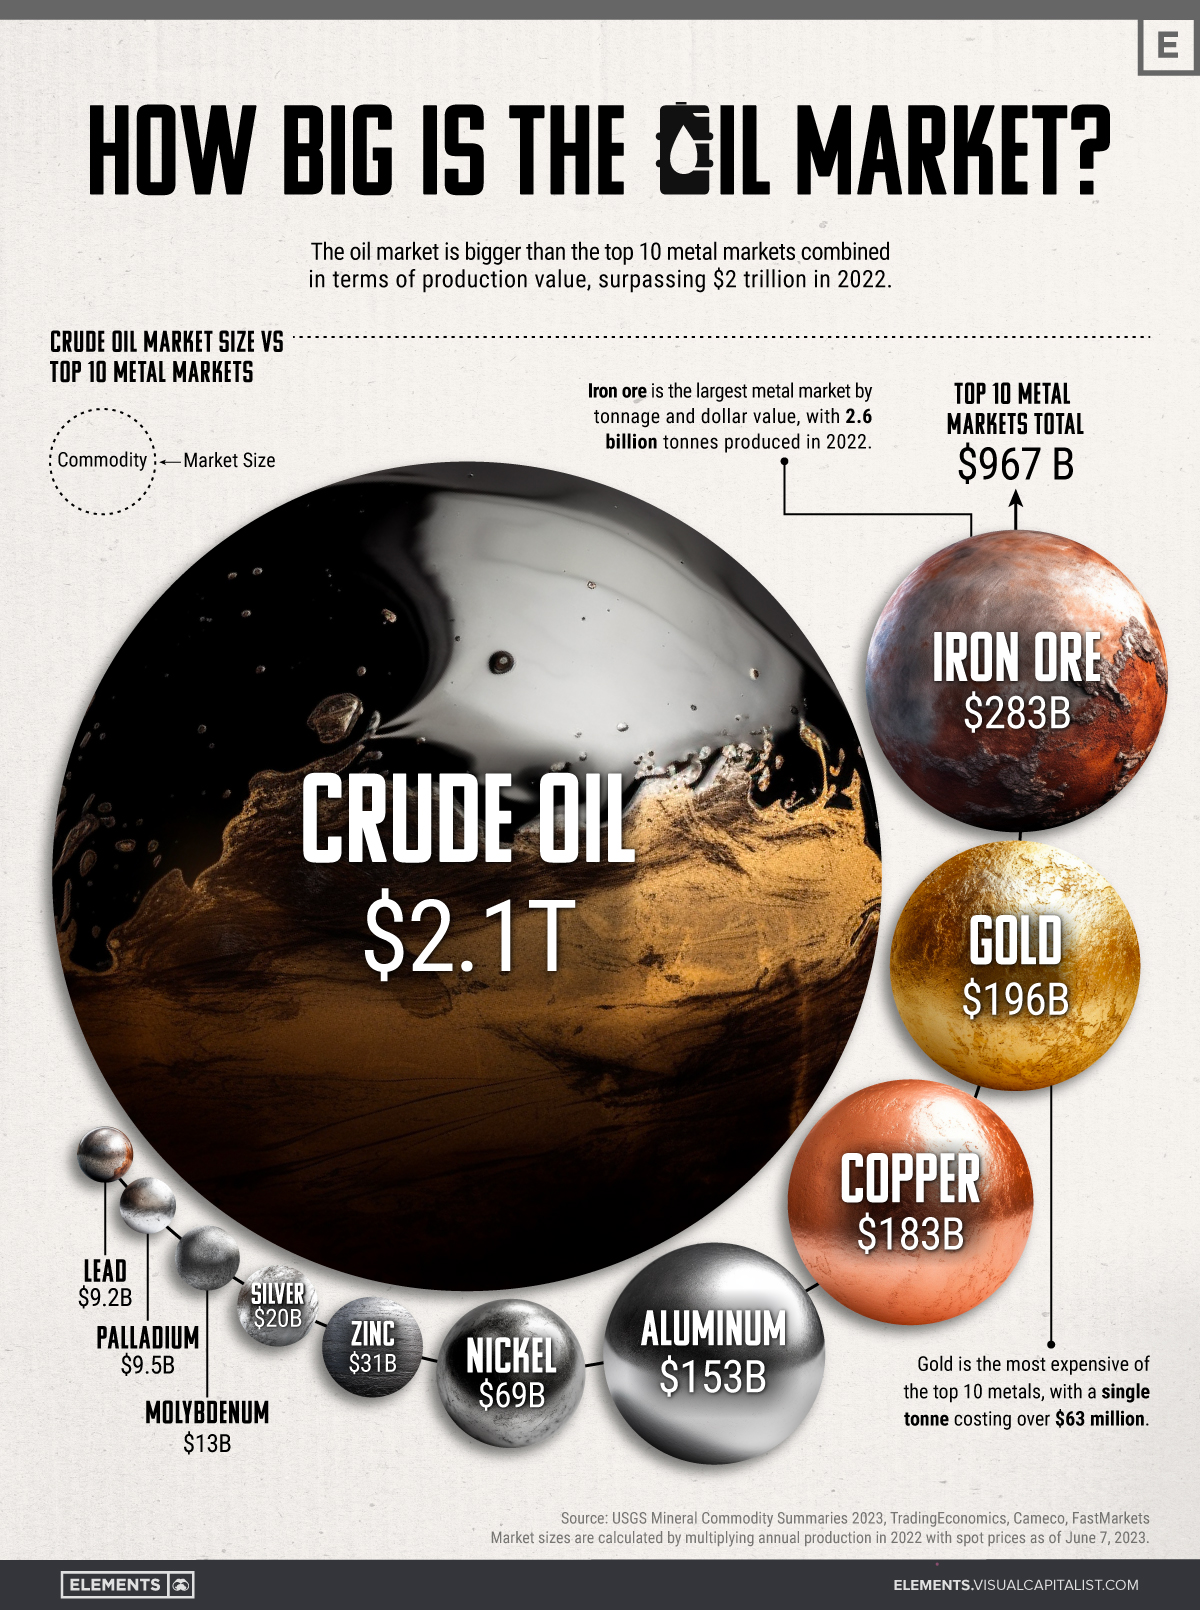
The above infographic puts crude oil’s market size into perspective by comparing it to the 10 largest metal markets combined. To calculate market sizes, we used the latest price multiplied by global production in 2022, based on data from TradingEconomics and the United States Geological Survey (USGS).
Note: This analysis focuses on raw and physical materials, excluding derivative markets and alloy materials like steel.
How Big Is the Oil Market?
In 2022, the world produced an average of 80.75 million barrels of oil per day (including condensates). That puts annual crude oil production at around 29.5 billion barrels, with the market size exceeding $2 trillion at current prices.
That figure dwarfs the combined size of the 10 largest metal markets:
Based on prices as of June 7, 2023.
The combined market size of the top 10 metal markets amounts to $967 billion, less than half that of the oil market. In fact, even if we added all the remaining smaller raw metal markets, the oil market would still be far bigger.
This also reflects the massive scale of global oil consumption annually, with the resource having a ubiquitous presence in our daily lives.
Big Picture
While the oil market towers over metal markets, it’s important to recognize that this doesn’t downplay the importance of these commodities.
Metals form a critical building block of the global economy, playing a key role in infrastructure, energy technologies, and more. Meanwhile, precious metals like gold and silver serve as important stores of value.
As the world shifts towards a more sustainable future and away from fossil fuels, it’ll be interesting to see how the markets for oil and other commodities evolve.
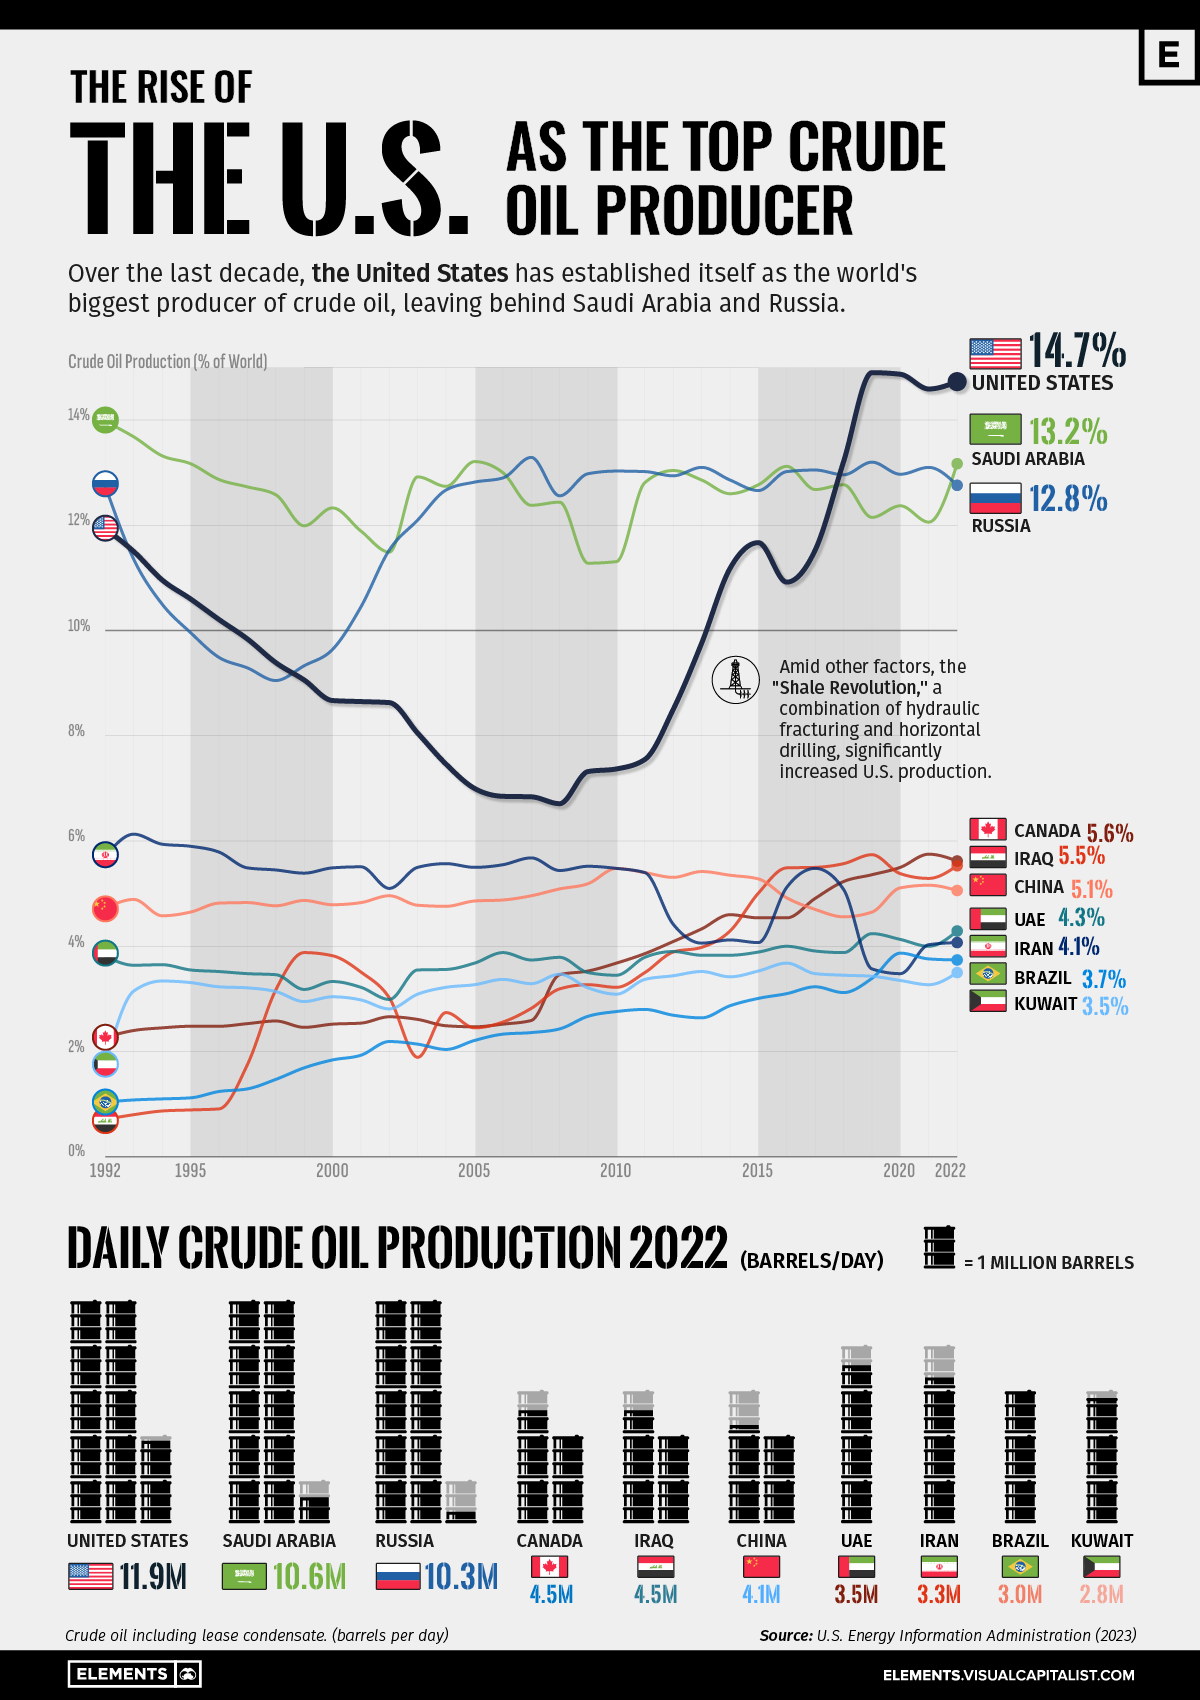
Infographic illustrates the rise of the U.S. as the biggest oil producer, based on data from the U.S. Energy Information Administration (EIA).
U.S. Takes Lead in 2018
Over the last three decades, the United States, Saudi Arabia, and Russia have alternated as the top crude producers, but always by small margins.
During the 1990s, Saudi Arabia dominated crude production, taking advantage of its extensive oil reserves. The petroleum sector accounts for roughly 42% of the country’s GDP, 87% of its budget revenues, and 90% of export earnings.
However, during the 2000s, Russia surpassed Saudi Arabia in production during some years, following strategic investments in expanding its oil infrastructure. The majority of Russia’s oil goes to OECD Europe (60%), with around 20% going to China.
Over the 2010s, the U.S. witnessed an increase in domestic production, much of it attributable to hydraulic fracturing, or “fracking,” in the shale formations ranging from Texas to North Dakota. It became the world’s largest oil producer in 2018, outproducing Russia and Saudi Arabia.
The U.S. accounted for 14.7% of crude oil production worldwide in 2022, compared to 13.1% for Saudi Arabia and 12.7% for Russia.
Despite leading petroleum production, the U.S. still trails seven countries in remaining proven reserves underground, with 55,251 million barrels.
Venezuela has the biggest reserves with 303,221 million barrels. Saudi Arabia, with 267,192 million barrels, occupies the second spot, while Russia is seventh with 80,000 million barrels.
Critical Minerals
China, EU, and U.S. Security
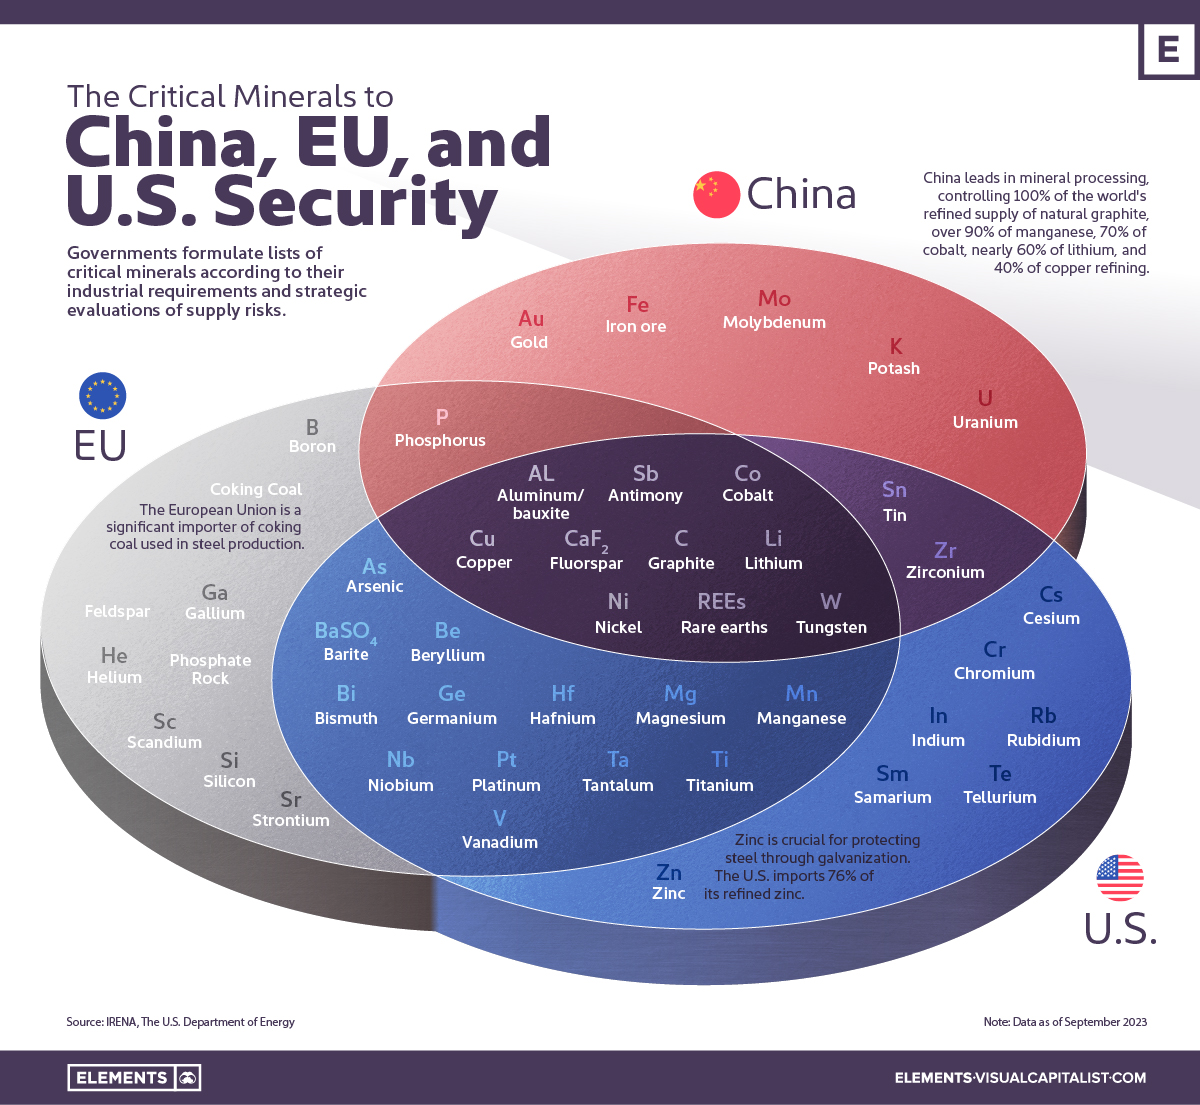
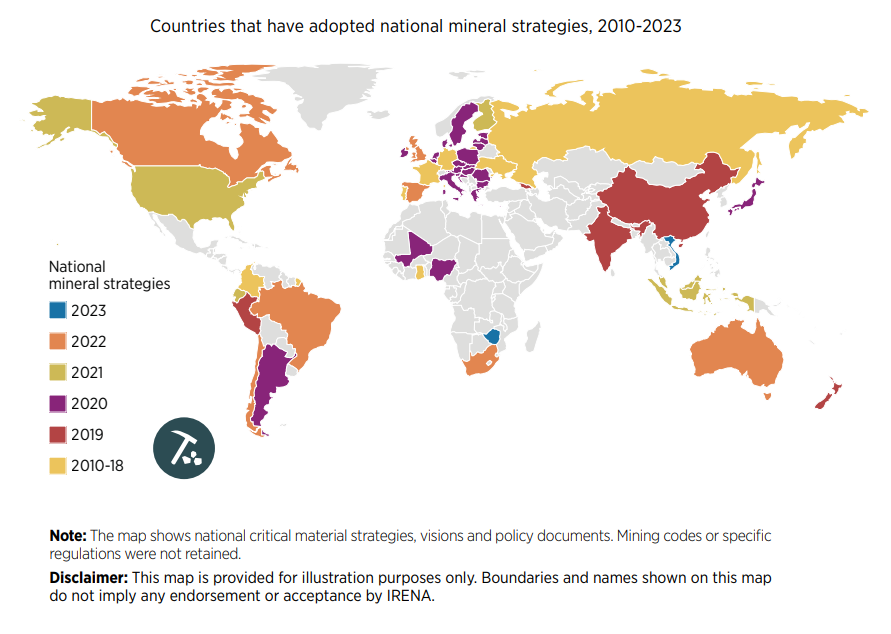
Governments formulate lists of critical minerals according to their industrial requirements and strategic evaluations of supply risks.
Over the last decade, minerals like nickel, copper, and lithium have been on these lists and deemed essential for clean technologies like EV batteries and solar and wind power.
This graphic uses IRENA and the U.S. Department of Energy data to identify which minerals are essential to China, the United States, and the European Union.
What are Critical Minerals?
There is no universally accepted definition of critical minerals. Countries and regions maintain lists that mirror current technology requirements and supply and demand dynamics, among other factors.
These lists are also constantly changing. For example, the EU’s first critical minerals list in 2011 featured only 14 raw materials. In contrast, the 2023 version identified 34 raw materials as critical.
One thing countries share, however, is the concern that a lack of minerals could slow down the energy transition.
With most countries committed to reducing greenhouse gas emissions, the total mineral demand from clean energy technologies is expected to double by 2040.
U.S. and EU
Seek to Reduce Import Reliance
on Critical Minerals
Ten materials feature on critical material lists of both the U.S., the EU, and China, including cobalt, lithium, graphite, and rare earths.
Despite having most of the same materials found in the U.S. or China’s list, the European list is the only one to include phosphate rock. The region has limited phosphate resources (only produced in Finland) and largely depends on imports of the material essential for manufacturing fertilizers.
Coking coal is also only on the EU list. The material is used in the manufacture of pig iron and steel. Production is currently dominated by China (58%), followed by Australia (17%), Russia (7%), and the U.S. (7%).
The U.S. has also sought to reduce its reliance on imports. Today, the country is 100% import-dependent on manganese and graphite and 76% on cobalt.
After decades of sourcing materials from other countries, the U.S. local production of raw materials has become extremely limited. For instance, there is only one operating nickel mine (primary) in the country, the Eagle Mine in Michigan. Likewise, the country only hosts one lithium source in Nevada, the Silver Peak Mine.
China’s Dominance
Despite being the world’s biggest carbon polluter, China is the largest producer of most of the world’s critical minerals for the green revolution.
China produces 60% of all rare earth elements used as components in high-technology devices, including smartphones and computers. The country also has a 13% share of the lithium production market. In addition, it refines around 35% of the world’s nickel, 58% of lithium, and 70% of cobalt.
Among some of the unique materials on China’s list is gold. Although gold is used on a smaller scale in technology, China has sought gold for economic and geopolitical factors, mainly to diversify its foreign exchange reserves, which rely heavily on the U.S. dollar.
Analysts estimate China has bought a record 400 tonnes of gold in recent years.
China has also slated uranium as a critical mineral. The Chinese government has stated it intends to become self-sufficient in nuclear power plant capacity and fuel production for those plants.
According to the World Nuclear Association, China aims to produce one-third of its uranium domestically.
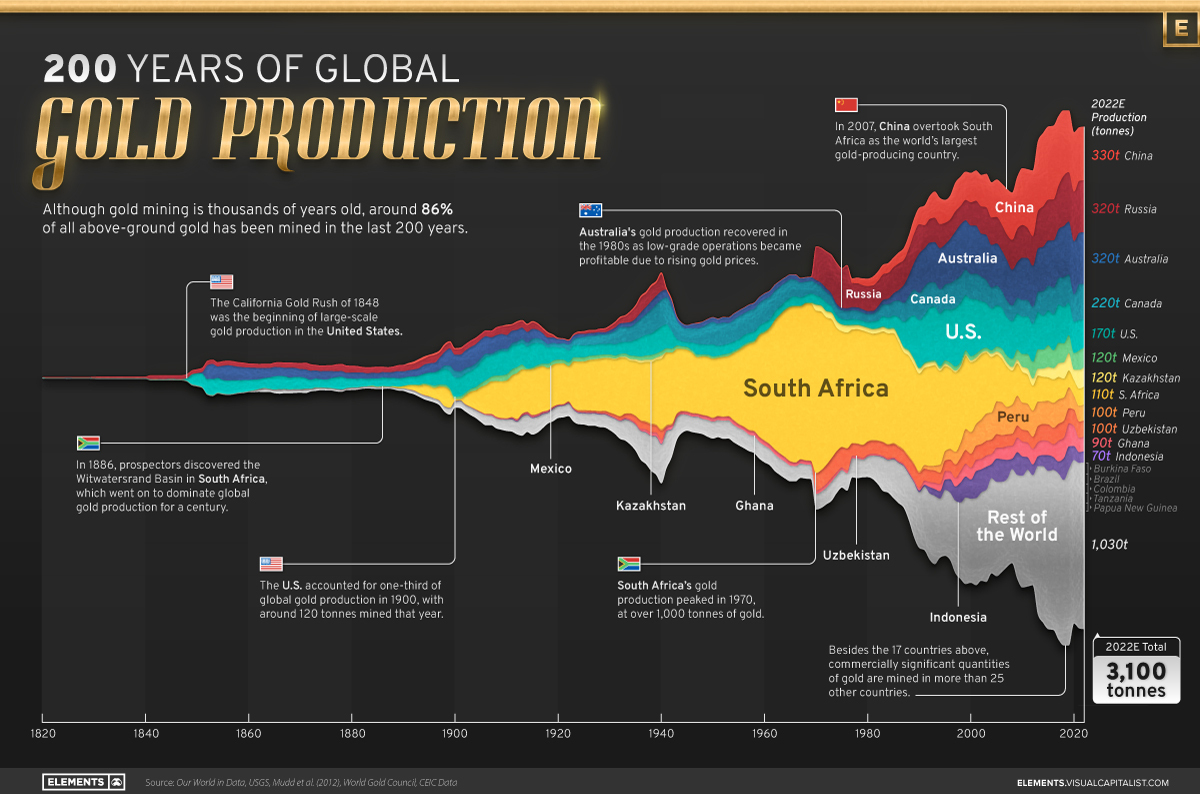
Visualizing Global Gold Production Over 200 Years
Although the practice of gold mining has been around for thousands of years, it’s estimated that roughly 86% of all above-ground gold was extracted in the last 200 years.
With modern mining techniques making large-scale production possible, global gold production has grown exponentially since the 1800s.
The above infographic uses data from Our World in Data to visualize global gold production by country from 1820 to 2022, showing how gold mining has evolved to become increasingly global over time.
A Brief History of Gold Mining
The best-known gold rush in modern history occurred in California in 1848, when James Marshall discovered gold in Sacramento Valley. As word spread, thousands of migrants flocked to California in search of gold, and by 1855, miners had extracted around $2 billion worth of gold.
The United States, Australia, and Russia were (interchangeably) the three largest gold producers until the 1890s. Then, South Africa took the helm thanks to the massive discovery in the Witwatersrand Basin, now regarded today as one of the world’s greatest ever goldfields.
South Africa’s annual gold production peaked in 1970 at 1,002 tonnes—by far the largest amount of gold produced by any country in a year.
With the price of gold rising since the 1980s, global gold production has become increasingly widespread. By 2007, China was the world’s largest gold-producing nation, and today a significant quantity of gold is being mined in over 40 countries.
The Top Gold-Producing Countries in 2022
Around 31% of the world’s gold production in 2022 came from three countries—China, Russia, and Australia, with each producing over 300 tonnes of the precious metal.
| Rank | Country | 2022E Gold Production, tonnes | % of Total |
|---|---|---|---|
| #1 | China | 330 | 11% |
| #2 | Russia | 320 | 10% |
| #3 | Australia | 320 | 10% |
| #4 | Canada | 220 | 7% |
| #5 | United States | 170 | 5% |
| #6 | Mexico | 120 | 4% |
| #7 | Kazakhstan | 120 | 4% |
| #8 | South Africa | 110 | 4% |
| #9 | Peru | 100 | 3% |
| #10 | Uzbekistan | 100 | 3% |
| #11 | Ghana | 90 | 3% |
| #12 | Indonesia | 70 | 2% |
| – | Rest of the World | 1,030 | 33% |
| – | World Total | 3,100 | 100% |
North American countries Canada, the U.S., and Mexico round out the top six gold producers, collectively making up 16% of the global total. The state of Nevada alone accounted for 72% of U.S. production, hosting the world’s largest gold mining complex (including six mines) owned by Nevada Gold Mines.
Meanwhile, South Africa produced 110 tonnes of gold in 2022, down by 74% relative to its output of 430 tonnes in 2000. This long-term decline is the result of mine closures, maturing assets, and industrial conflict, according to the World Gold Council.
Interestingly, two smaller gold producers on the list, Uzbekistan and Indonesia, host the second and third-largest gold mining operations in the world, respectively.
The Outlook for Global Gold Production
As of April 25, gold prices were hovering around the $2,000 per ounce mark and nearing all-time highs. For mining companies, higher gold prices can mean more profits per ounce if costs remain unaffected.
According to the World Gold Council, mined gold production is expected to increase in 2023 and could surpass the record set in 2018 (3,300 tonnes), led by the expansion of existing projects in North America. The chances of record mine output could be higher if gold prices continue to increase.
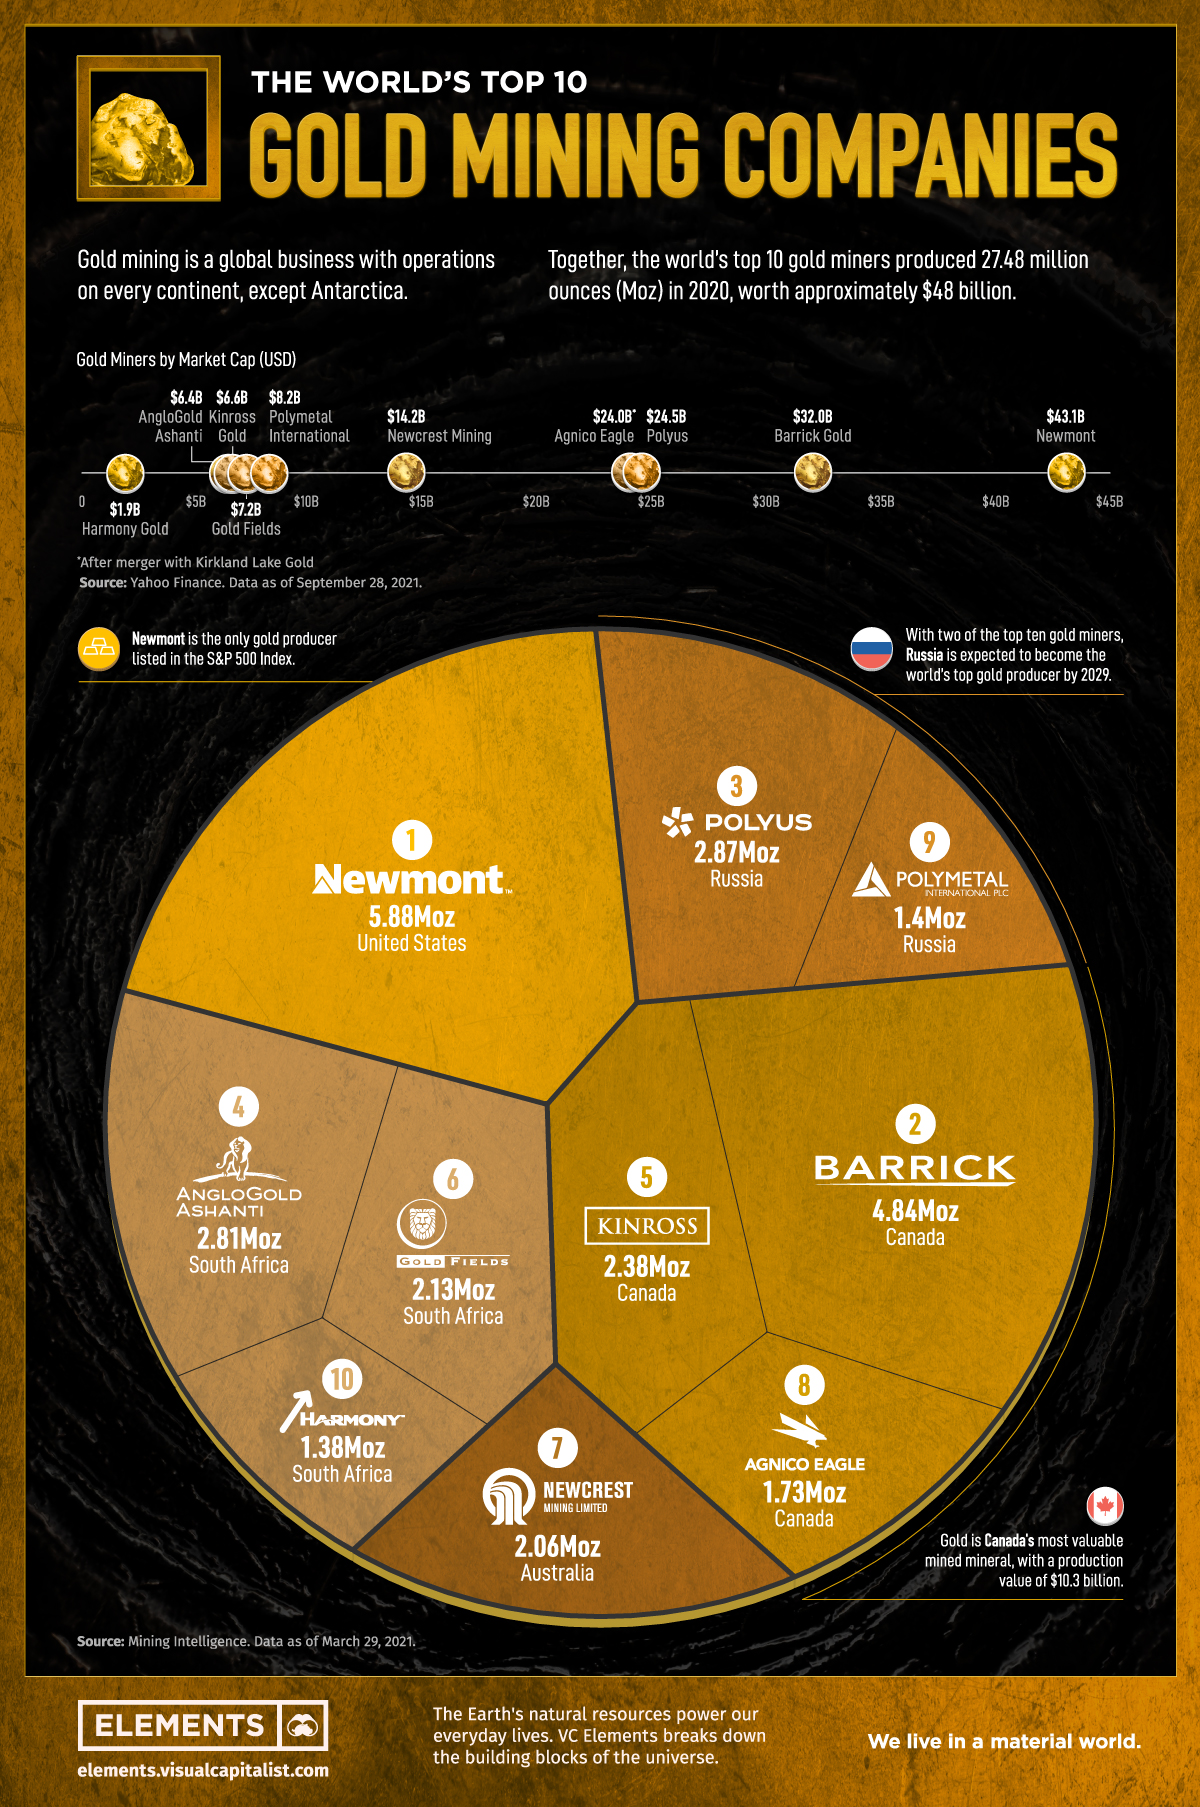
The World’s Top 10 Gold Mining Companies
Unlike paper currency or many other types of assets, gold has maintained its value throughout the ages.
First used by cultures in modern-day Eastern Europe in 4,000 BC to make decorative objects, the metal today represents a global business with operations on every continent, except Antarctica.
The industry is dominated by a select group of majors.
Together, the world’s top 10 gold miners produced 27.48 million ounces (Moz) in 2020, worth approximately $48 billion, according to data from Mining Intelligence.
North America Leading
At a country level, China is the largest producer in the world accounting for around 11% of total global production.
However, no Chinese company appears among the top miners.
| Rank | Company | Headquarters | Country | 2020 Production (Moz) |
|---|---|---|---|---|
| 1 | Newmont | Denver | USA | 5.88 |
| 2 | Barrick Gold | Toronto | Canada | 4.84 |
| 3 | Polyus | Moscow | Russia | 2.87 |
| 4 | AngloGold Ashanti | Johannesburg | South Africa | 2.81 |
| 5 | Kinross Gold | Toronto | Canada | 2.38 |
| 6 | Gold Fields | Johannesburg | South Africa | 2.13 |
| 7 | Newcrest Mining | Melbourne | Australia | 2.06 |
| 8 | Agnico Eagle | Toronto | Canada | 1.73 |
| 9 | Polymetal International | St. Petersburg | Russia | 1.40 |
| 10 | Harmony Gold | Johannesburg | South Africa | 1.38 |
At the top of the gold mining companies list, Colorado-based Newmont has ownership of mines in Nevada, Colorado, Ontario, Quebec, Mexico, the Dominican Republic, Australia, Ghana, Argentina, Peru, and Suriname.
As the only American company on the list, Newmont produces 21% of the yellow metal poured by the top companies.
Canada, which is known for its mining industry, has three companies on the list; Barrick Gold, Kinross Gold, and Agnico Eagle, producing 32% combined.
Russia, which is expected to become the world’s top producer by 2029, has two companies ranked. Together, Polyus and Polymetal represent 15% of the top miners’ production.
The top 10 players account for ~22% of the total market share, which is anticipated to grow due to increased merger and acquisition activities.
Wealth and Luxury
Over six and a half thousand years after its discovery, more than 90% of the gold mined annually is destined for jewelry, bullion, and coins.
- Jewelry: 36.83%,
- Investment: 46.64%,
- Central banks: 8.58%,
- Technology: 7.95%
The metal is also used in dentistry, as it is the best material for fillings and crowns since it is easy to insert, and is non-reactive with the human body.
Golden Future
Global production fell by 1% in 2020, the first decline in a decade, according to the World Gold Council.
Some analysts argue the world has reached “peak gold” – which means that the maximum rate of extraction has passed and the production of the metal will continue to fall until, eventually, mining for it shall cease entirely.
Demand, however, shows no sign of slowing down as the golden metal remains firmly synonymous with security, stability, and longevity.
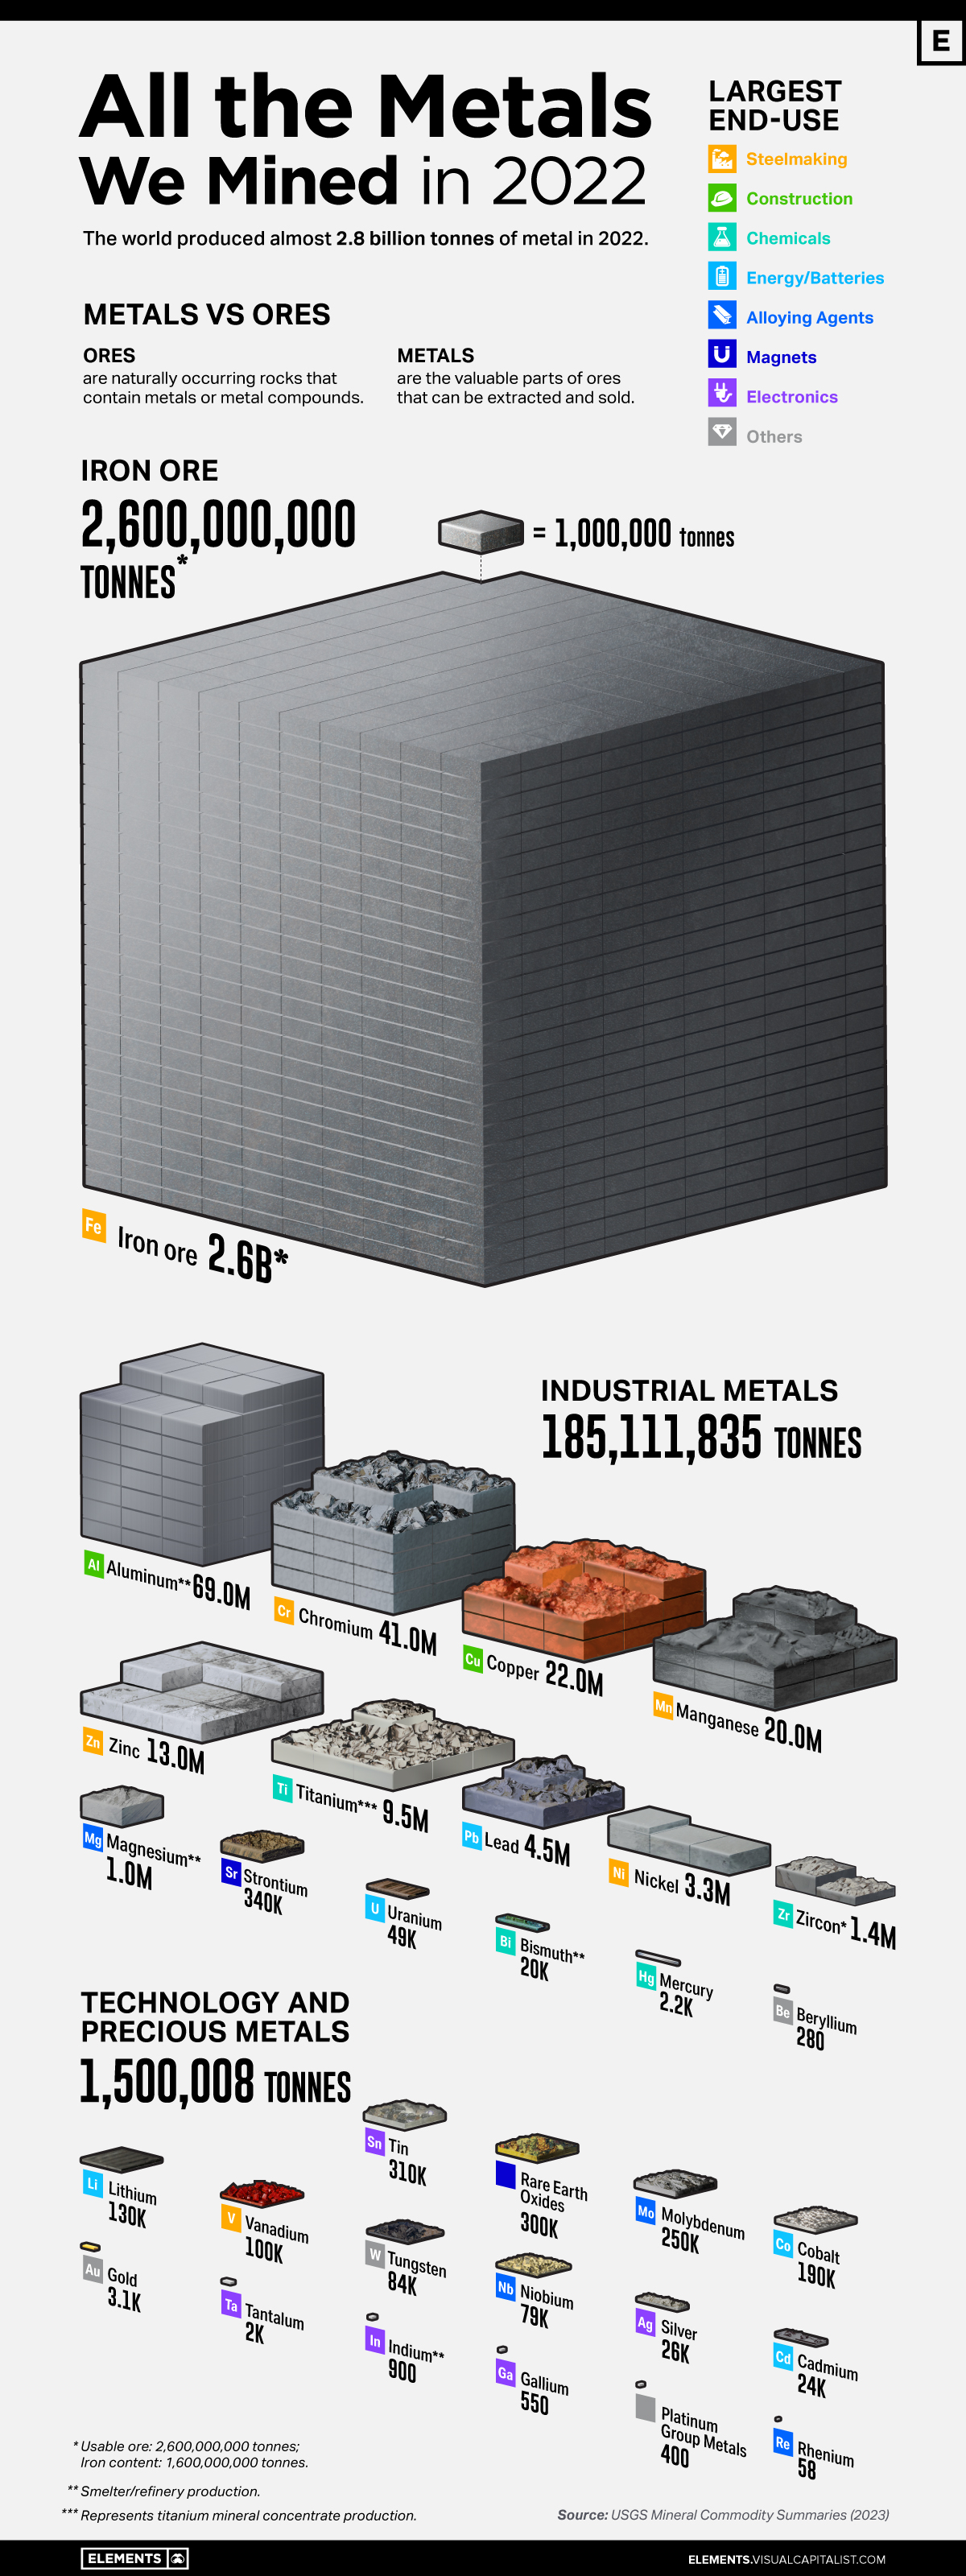
Metals are a big part of our daily lives, found in every building we enter and all devices we use.
Today, major industries that directly consume processed mineral materials contribute 14% of the United States economy.
The above infographic visualizes all 2.8 billion tonnes of metals mined in 2022 and highlights each metal’s largest end-use using data from the United States Geological Survey (USGS).
Iron Ore Dominance
Iron ore dominates the metals mining landscape, comprising 93% of the total mined. In 2022, 2.6 billion tonnes of iron ore were mined, containing about 1.6 billion tonnes of iron.
Iron ores are found in various geologic environments, such as igneous, metamorphic, or sedimentary rocks, and can contain over 70% iron, with many falling in the 50-60% range.
Combined with other materials like coke and limestone, iron ore is primarily used in steel production. Today, almost all (98%) iron ore is dedicated to steelmaking.
The ore is typically mined in about 50 countries, but Australia, Brazil, China, and India are responsible for 75% of the production.
Because of its essential role in infrastructure development, iron ore is one of the most crucial materials underpinning urbanization and economic growth.
Industrial Metals
Industrial metals occupy the second position on our list, constituting 6.6% of all metals mined in 2022. These metals, including copper, aluminum, lead, and zinc, are employed in construction and industrial applications.
Aluminum constituted nearly 40% of industrial metal production in 2022. China was responsible for 56% of all aluminum produced.
In the second position is chromium, which plays a primary role in rendering stainless steel corrosion-resistant. South Africa led chromium production, accounting for 44% of the total mined last year.
Technology and Precious Metals
Despite representing less than 1% of all the metals mined, technology metals have been on the news over the last few years as countries and companies seek these materials to reduce carbon emissions and improve productivity.
They include lithium and cobalt, used in electric vehicles and battery storage, and rare earths, used in magnets, metal alloys, and electronics. Many of them are considered critical for countries’ security due to their role in clean energy technologies and dependency on other nations to supply domestic demand.
However, despite increasing interest in these metals, they are still behind precious metals such as gold and silver regarding market size.
The gold market, for example, reached $196 billion in 2022, compared to $10.6 billion for the rare earths market.
| Metal/Ore | Quantity Mined in 2022 (tonnes) | % of Total |
|---|---|---|
| Iron ore | 2,600,000,000 | 93.3% |
| Industrial metals | 185,111,835 | 6.6% |
| Technology and Precious Metals | 1,500,008 | 0.05% |
| Total | 2,786,611,843 | 100% |
Percentages may not add up to 100 due to rounding.
| Industrial Metals | 2022 Mine Production (tonnes) | % of Total |
|---|---|---|
| Aluminum | 69,000,000 | 37.3% |
| Chromium | 41,000,000 | 22.1% |
| Copper | 22,000,000 | 11.9% |
| Manganese | 20,000,000 | 10.8% |
| Zinc | 13,000,000 | 7.0% |
| Titanium (mineral concentrates) | 9,500,000 | 5.1% |
| Lead | 4,500,000 | 2.4% |
| Nickel | 3,300,000 | 1.8% |
| Zirconium Minerals (Zircon) | 1,400,000 | 0.8% |
| Magnesium | 1,000,000 | 0.5% |
| Total | 185,111,835 | 100% |
| Technology and Precious Metals | 2022 Mine Production (tonnes) | % of Total |
|---|---|---|
| Tin | 310,000 | 20.7% |
| Rare Earth Oxides | 300,000 | 20.0% |
| Molybdenum | 250,000 | 16.7% |
| Cobalt | 190,000 | 12.7% |
| Lithium | 130,000 | 8.7% |
| Vanadium | 100,000 | 6.7% |
| Tungsten | 84,000 | 5.6% |
| Niobium | 79,000 | 5.3% |
| Silver | 26,000 | 1.7% |
| Cadmium | 24,000 | 1.6% |
| Total | 1,500,008 | 100% |
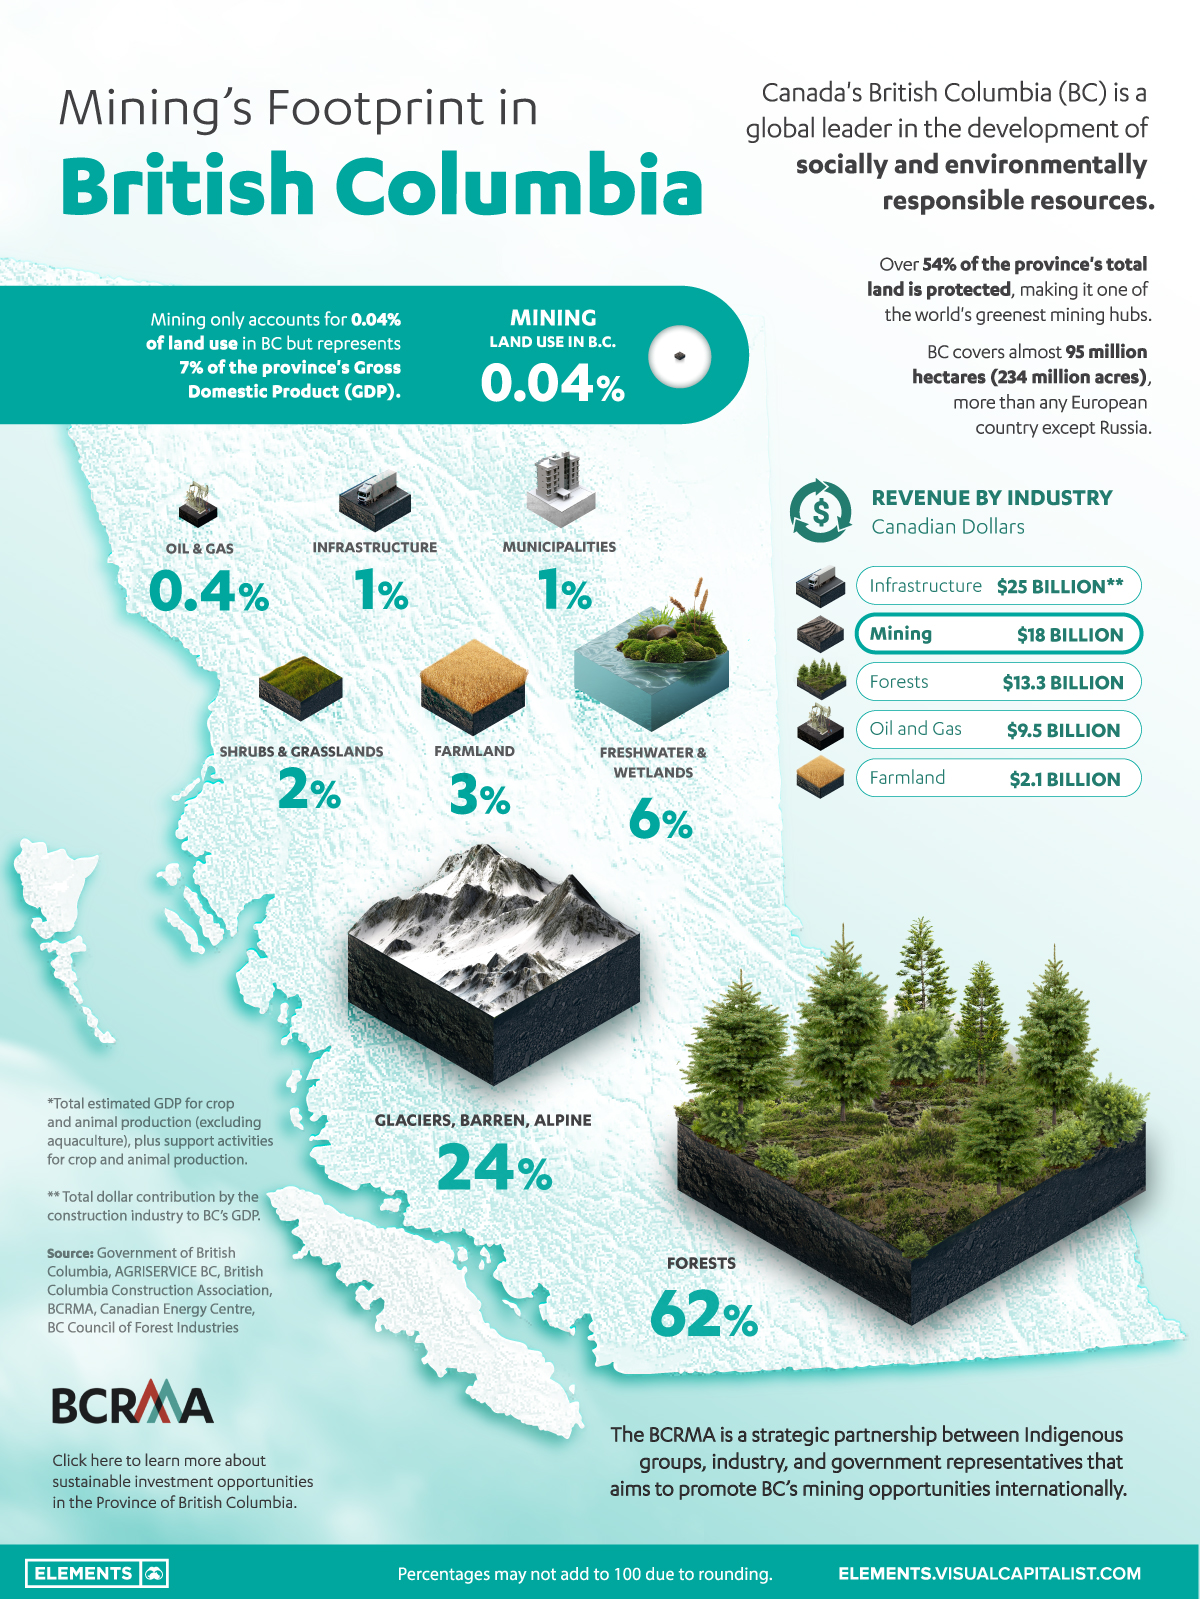
British Columbia
British Columbia is considered a global leader in the development of socially and environmentally responsible resources.
An estimated 54% of the province’s total land is protected, making it one of the world’s greenest mining hubs.
This graphic by the B.C. Regional Mining Alliance (BCRMA) details mining’s footprint in the province.
Tier 1 Jurisdiction for Mining
British Columbia covers almost 95 million hectares (234 million acres), more than any European country except Russia, and more than any U.S. state except Alaska.
As the largest mining province in Canada, BC registered $18 billion in revenue from the industry in 2022.
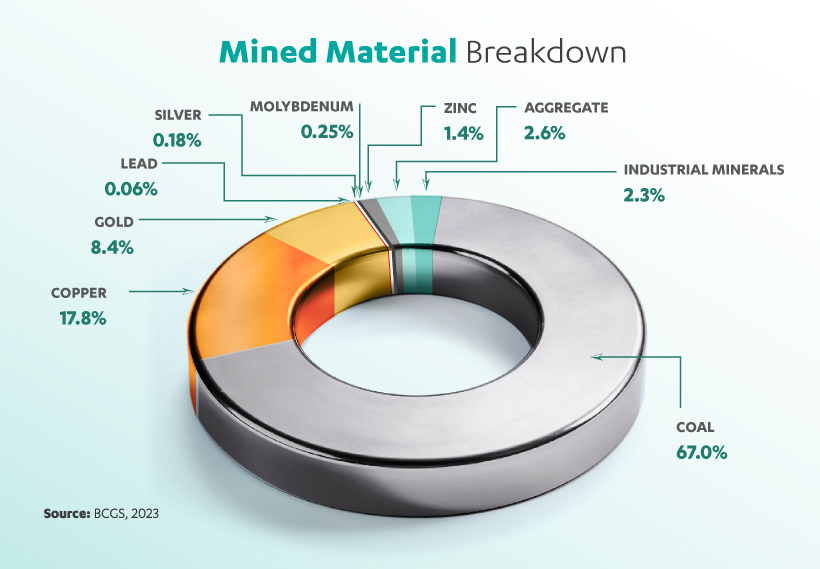
British Columbia stands as Canada’s sole producer of molybdenum, which finds applications in metallurgy and chemistry. Additionally, B.C. is the country’s leader producer of copper and steelmaking coal, besides gold and silver.
At the heart of British Columbia’s mining industry lies the Golden Triangle, one of the hottest mineral exploration districts in the world.
More than 150 mines have operated in the area since prospectors first arrived at the end of the 19th century. The region alone is endowed with minerals worth more than $800 billion.
How Green is B.C. Mining?
Mining represents 7% of the province’s Gross Domestic Product (GDP), despite only accounting for 0.04% of the land use. In comparison, farmland demands 3% of the land, bringing $2.1 billion (0.8%) per year.
Mining operations are also supported by a stable, transparent, and effective policy environment. The province ranked as the world’s least risky for mining in 2017 and 2018.
In addition, mineral exploration has received ample support from local Indigenous communities. Today, mining accounts for over two-thirds of all indigenous people employed in the extractives sector.
According to the International Energy Agency, up to six times more minerals and metals will be needed by 2040 to accelerate the energy transition.
In this scenario, British Columbia is well positioned to support the transition to a low-carbon future and make a significant contribution to climate action.
The BCRMA is a strategic partnership between indigenous groups, industry, and government representatives that aims to promote B.C.’s mining opportunities internationally.
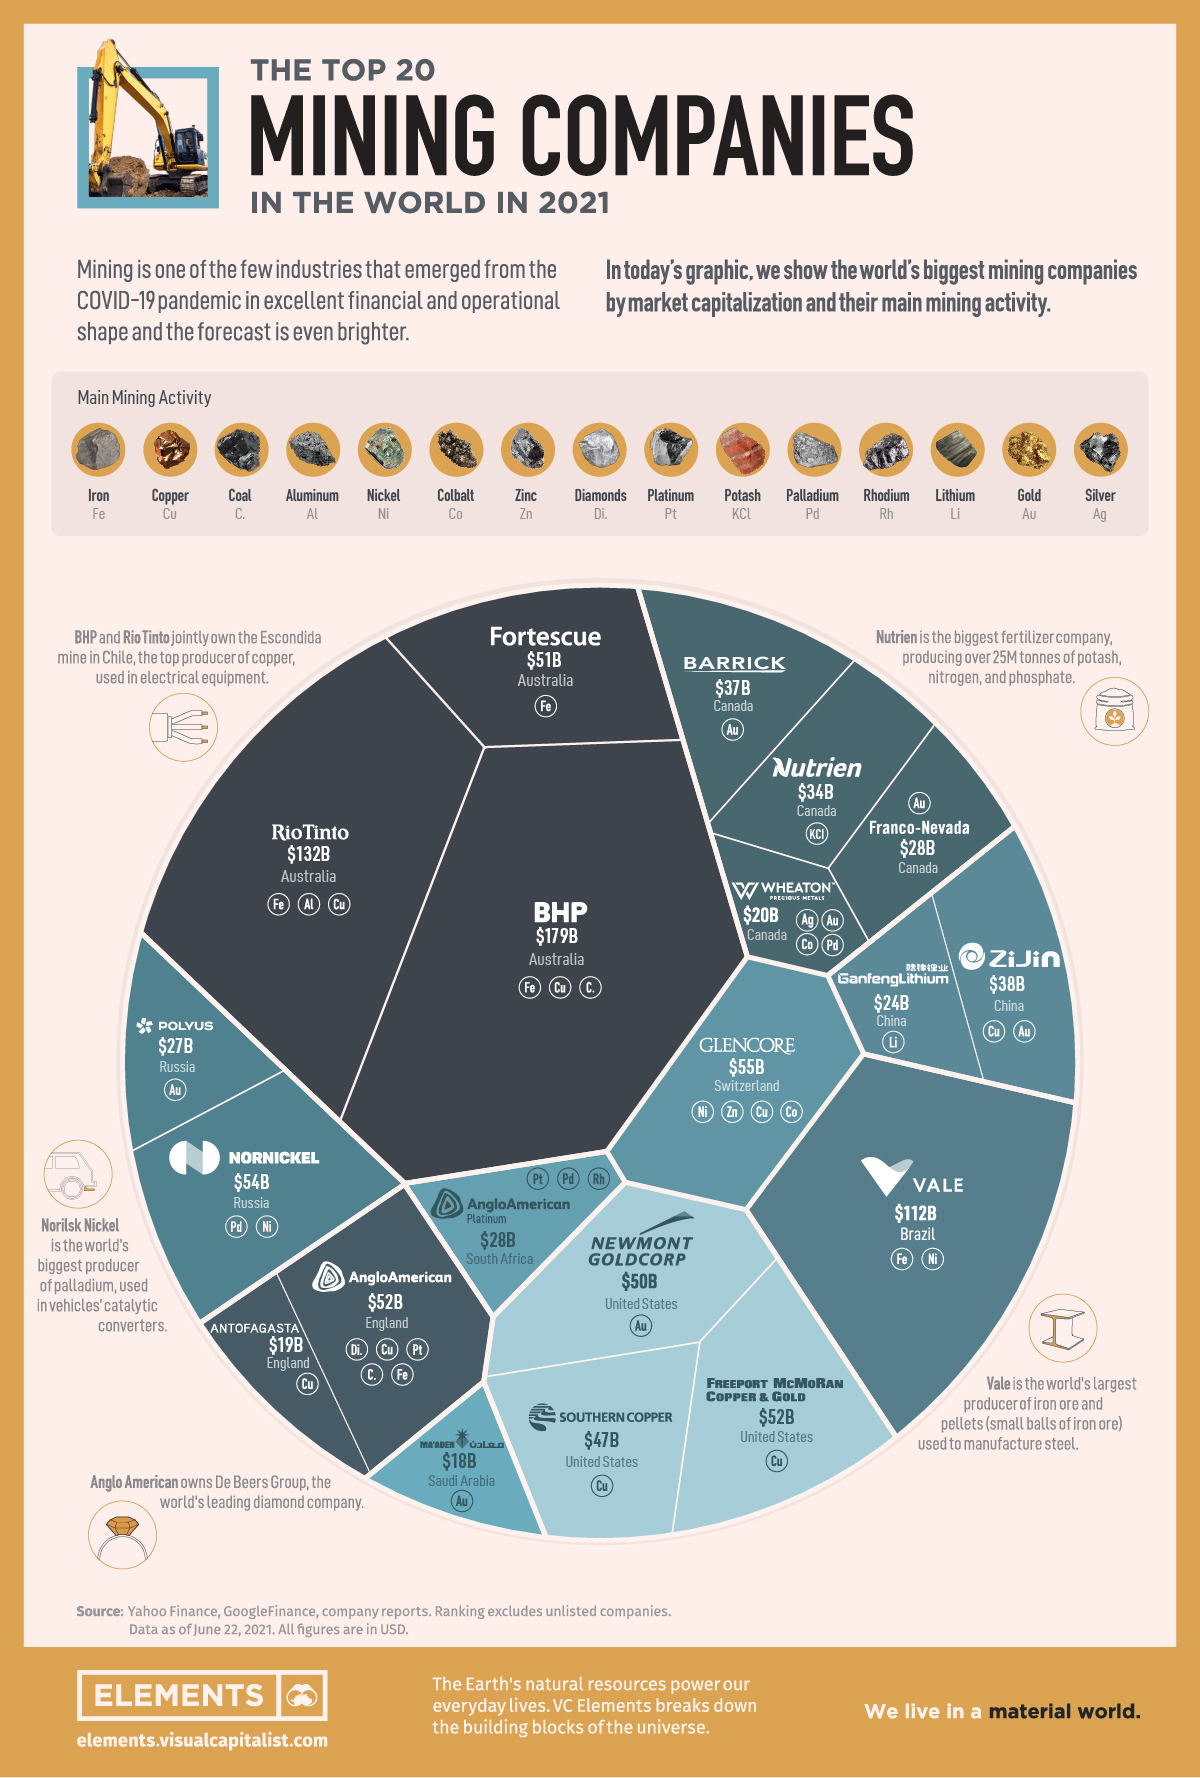
Ranked: Top 20 Mining Companies
Mining companies have emerged from the COVID-19 pandemic in excellent financial and operational shape and the forecast is even brighter as the economy recovers.
The market is expected to reach a value of nearly $1.86 trillion by 2022, with the increasing demand for minerals for power generation and renewables technology.
In the graphic above, we show the world’s top companies by market capitalization as of June 22, 2021, and the metals they mine.
Bottom Line: From Smartphones to Food
From roads, hospitals, automobiles, houses, computers, satellites, and even fertilizer for crops, mining provides many of the materials we interact with every day. Copper, iron, rare earth metals, aluminum, and phosphate are just a handful of the mined materials that make modern life and feed the bottom line for mining companies.
The two biggest by market capitalization, BHP ($179B) and Rio Tinto ($132B), both produce a range of commodities, mainly iron ore and copper. The next on the list is also the biggest company in Brazil, Vale ($112B). The miner is the world’s largest producer of iron ore and pellets (small balls of iron ore) used to manufacture steel.
A $57 billion gap separates the top 3 from the rest of the group. In fourth place comes Glencore ($55B) with its mixed operations of trading and mining metals, agricultural products, and oil and gas.
The automotive industry is a big consumer of metals, which explains Norilsk Nickel’s ($54B) fifth place. The company, owned by the wealthiest man in Russia, is the world’s biggest producer of palladium, used in vehicles’ catalytic converters.
Miners also serve the luxury market, with precious metals like gold, silver, and gemstones. Number six on the list, Anglo American ($52B) is one of the world’s leading diamond companies.
In terms of countries, Canada leads the ranking with 4 miners on the list. The United States and Australia come next with 3 companies each.
Charging and Changing the Future of Mining Companies
The United States, Europe, and Asia are making big investments in electrification and power generation. By 2024, almost 33% of the world’s electricity is forecast to come from renewables.
This shift from fossil fuels will require a lot of copper, cobalt, and lithium for batteries. Mining companies are in a position to capitalize as the market expands.
For example, no. 17 in the list, China’s Ganfeng Lithium, the world’s third-largest producer of lithium chemicals for batteries, saw its market capitalization grow more than 25% in 2021.
The energy transition is just beginning, and the materials used in building a more sustainable future will also build up the largest mining companies of tomorrow.
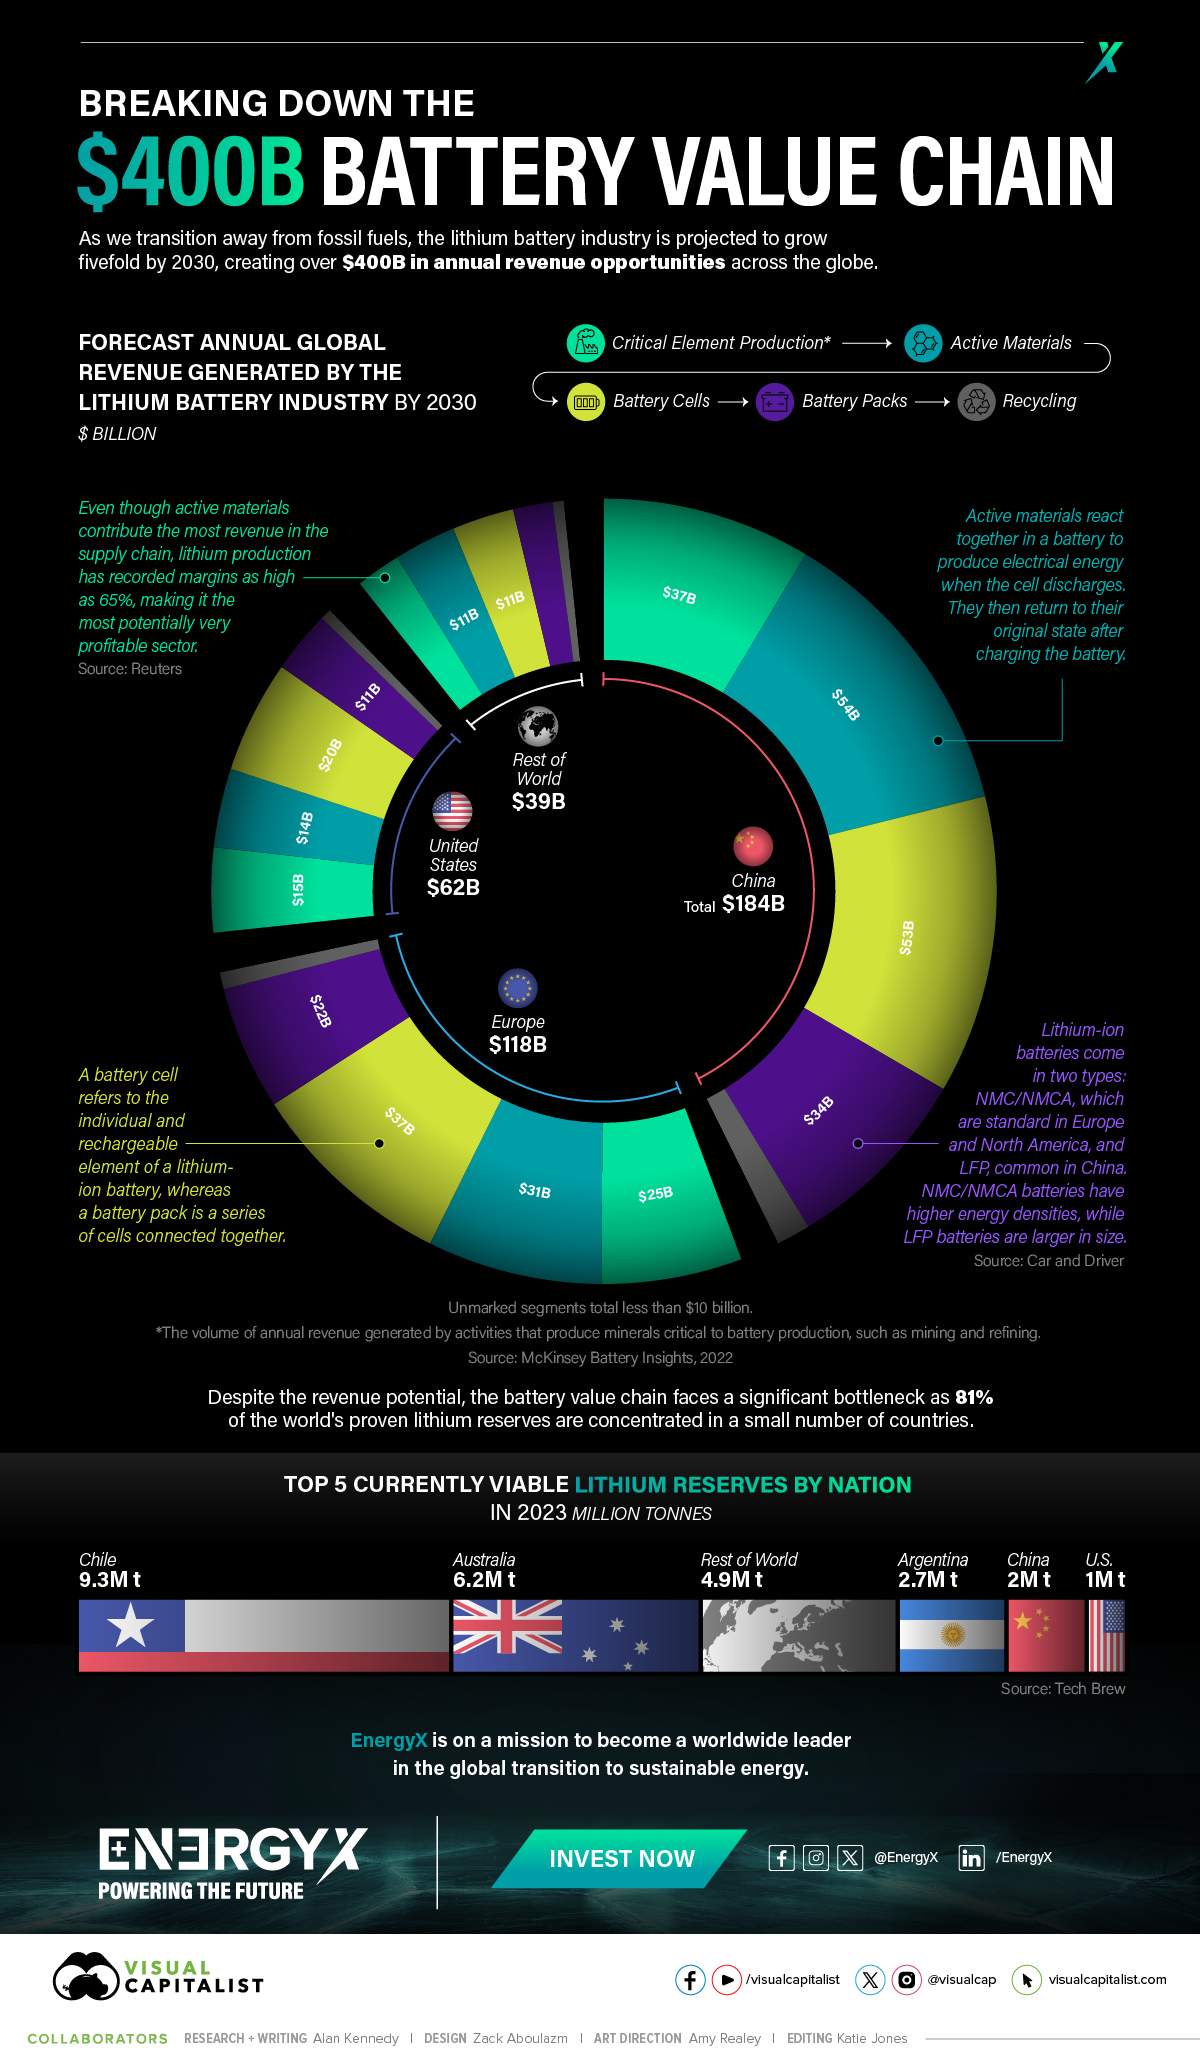
Breaking Down the $400 Billion Battery Value Chain
As the world transitions away from fossil fuels toward a greener future, the lithium battery industry could grow fivefold by 2030. This shift could create over $400 billion in annual revenue opportunities globally.
For this graphic, we partnered with EnergyX to determine how the battery industry could grow by 2030.
Exploring the Battery Value Chain
The lithium battery value chain has many links within it that each generate their own revenue opportunities, these include:
- Critical Element Production: Involves the mining and refining of materials used in a battery’s construction.
- Active materials: Creating and developing materials that react electrochemically to allow batteries to charge and discharge.
- Battery cells: Involves the production of rechargeable elements of a battery.
- Battery packs: Producing packs containing a series of connected battery cells. Generally, these come in two types: NMC/NMCA, the standard in North America and Europe, and LFP, the standard in China.
- Recycling: Reusing battery components within new batteries.
But these links aren’t equal, each one is projected to generate different levels of revenue by 2030:
On the surface, battery cell production may contribute the most revenue to the battery value chain. However, lithium production can generate margins as high as 65%, meaning lithium production has potential to yield large margins.
How Much Lithium Is Available?
Just a few countries hold 81% of the world’s viable lithium. So, supply bottlenecks could slow the growth of the lithium battery industry:
Supplying the World With Batteries
Supplying the world with lithium is critical to the battery value chain and a successful transition from fossil fuels. Players like the U.S. and the EU, with increasingly large and growing lithium needs, will need to maximize local opportunities and work together to meet demand.
EnergyX is on a mission to become a world leader in the global transition to sustainable energy, using cutting-edge direct lithium extraction to help supply the world with lithium.
Click here to add your own text
Click here to add your own text
Click here to add your own text
Click here to add your own text