

Click here to add your own text
Mapped: The Top U.S. Imports by State
In 2021, the U.S. brought in approximately $2.83 trillion worth of goods from its various international trading partners.
But what types of goods are most commonly imported throughout different parts of America? This graphic by OnDeck shows the top import in every U.S. state, using January 2022 data from the U.S. Census Bureau.
The Most Popular Categories of U.S. Imports
Petroleum is the most popular import in 12 states, making it the most common import across America. In 2021, about 72% of imported petroleum was crude oil, which was then domestically refined into products like gasoline, diesel, or jet fuel.
A majority of that imported petroleum came from Canada, while roughly 11% was imported from OPEC countries, and 8% came from Russia. Of course, the latter figure will likely dip in 2022 because of the ban on Russian imports implemented by the Biden administration in response to the Russia-Ukraine conflict.
After petroleum, vehicles and medicine were tied for the second most-imported goods, with both categories being the most popular import in six states each.
Somewhat related to medicine are nucleic acids, which were the top imports in Florida and Nebraska. Nucleic acids are natural polymers that are used in biological processes like protein synthesis or messenger RNA (mRNA) translation. It’s worth noting that several COVID-19 vaccines, including those produced by Moderna and Pfizer-BioNTech, are mRNA vaccines.
The Most Unique U.S. Imports
In addition to outlining the most popular imports in each U.S. state, OnDeck highlights each state’s most unique import, visualized in the graphic below.


Click here to add your own text
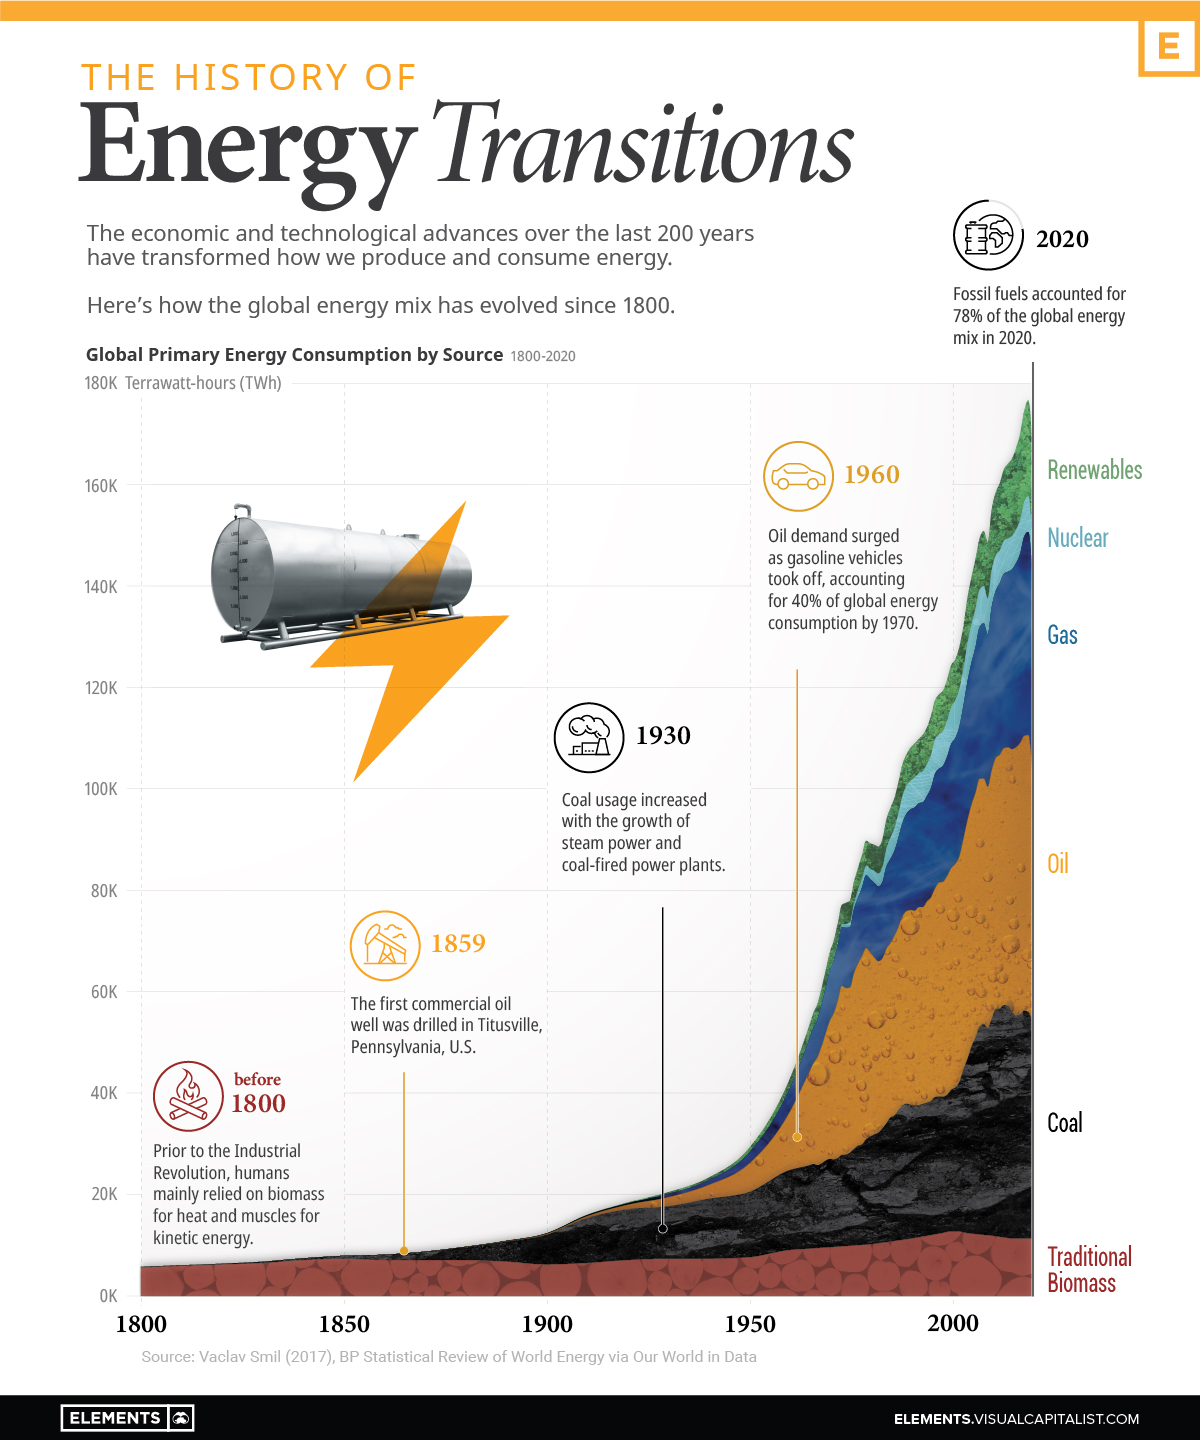
The History of Energy Transitions
Over the last 200 years, how we’ve gotten our energy has changed drastically.
These changes were driven by innovations like the steam engine, oil lamps, internal combustion engines, and the wide-scale use of electricity. The shift from a primarily agrarian global economy to an industrial one called for new sources to provide more efficient energy inputs.
The current energy transition is powered by the realization that avoiding the catastrophic effects of climate change requires a reduction in greenhouse gas emissions. This infographic provides historical context for the ongoing shift away from fossil fuels using data from Our World in Data and scientist Vaclav Smil.
Coal and the First Energy Transition
Before the Industrial Revolution, people burned wood and dried manure to heat homes and cook food, while relying on muscle power, wind, and water mills to grind grains. Transportation was aided by using carts driven by horses or other animals.
In the 16th and 17th centuries, the prices of firewood and charcoal skyrocketed due to shortages. These were driven by increased consumption from both households and industries as economies grew and became more sophisticated.
Consequently, industrializing economies like the UK needed a new, cheaper source of energy. They turned to coal, marking the beginning of the first major energy transition.
| Year | Traditional Biomass % of Energy Mix | Coal % of Energy Mix |
|---|---|---|
| 1800 | 98.3% | 1.7% |
| 1820 | 97.6% | 2.4% |
| 1840 | 95.1% | 4.9% |
| 1860 | 86.8% | 13.3% |
| 1880 | 73.0% | 26.7% |
| 1900 | 50.4% | 47.2% |
| 1920 | 38.4% | 54.4% |
| 1940 | 31.6% | 50.7% |
As coal use and production increased, the cost of producing it fell due to economies of scale. Simultaneously, technological advances and adaptations brought about new ways to use coal.
The steam engine—one of the major technologies behind the Industrial Revolution—was heavily reliant on coal, and homeowners used coal to heat their homes and cook food. This is evident in the growth of coal’s share of the global energy mix, up from 1.7% in 1800 to 47.2% in 1900.
The Rise of Oil and Gas
In 1859, Edwin L. Drake built the first commercial oil well in Pennsylvania, but it was nearly a century later that oil became a major energy source.
Before the mass production of automobiles, oil was mainly used for lamps. Oil demand from internal combustion engine vehicles started climbing after the introduction of assembly lines, and it took off after World War II as vehicle purchases soared.
Similarly, the invention of the Bunsen burner opened up new opportunities to use natural gas in households. As pipelines came into place, gas became a major source of energy for home heating, cooking, water heaters, and other appliances.
| Year | Coal % of Energy Mix | Oil % of Energy Mix | Natural Gas % of Energy Mix |
|---|---|---|---|
| 1950 | 44.2% | 19.1% | 7.3% |
| 1960 | 37.0% | 26.6% | 10.7% |
| 1970 | 25.7% | 40.2% | 14.5% |
| 1980 | 23.8% | 40.6% | 16.3% |
| 1990 | 24.4% | 35.5% | 18.4% |
| 2000 | 22.5% | 35.1% | 19.7% |
Coal lost the home heating market to gas and electricity, and the transportation market to oil.
Despite this, it became the world’s most important source of electricity generation and still accounts for over one-third of global electricity production today.
The Transition to Renewable Energy
Renewable energy sources are at the center of the ongoing energy transition. As countries ramp up their efforts to curb emissions, solar and wind energy capacities are expanding globally.
Here’s how the share of renewables in the global energy mix changed over the last two decades:
| Year | Traditional Biomass | Renewables | Fossil Fuels | Nuclear Power |
|---|---|---|---|---|
| 2000 | 10.2% | 6.6% | 77.3% | 5.9% |
| 2005 | 8.7% | 6.5% | 79.4% | 5.4% |
| 2010 | 7.7% | 7.7% | 79.9% | 4.7% |
| 2015 | 6.9% | 9.2% | 79.9% | 4.0% |
| 2020 | 6.7% | 11.2% | 78.0% | 4.0% |
In the decade between 2000 and 2010, the share of renewables increased by just 1.1%. But the growth is speeding up—between 2010 and 2020, this figure stood at 3.5%.
Furthermore, the current energy transition is unprecedented in both scale and speed, with climate goals requiring net-zero emissions by 2050. That essentially means a complete fade-out of fossil fuels in less than 30 years and an inevitable rapid increase in renewable energy generation.
Renewable energy capacity additions were on track to set an annual record in 2021, following a record year in 2020. Additionally, global energy transition investment hit a record of $755 billion in 2021.
However, history shows that simply adding generation capacity is not enough to facilitate an energy transition. Coal required mines, canals, and railroads; oil required wells, pipelines, and refineries; electricity required generators and an intricate grid.
Similarly, a complete shift to low-carbon sources requires massive investments in natural resources, infrastructure, and grid storage, along with changes in our energy consumption habits.
approaches for long-term assignment
click
After using home-based approaches (balance sheet) for international assignees for decades, is it time to switch to the host-based approach and simply localize mobile employees?
Israeli lab says it developed brain scan to make early Parkinson’s screening routine
Regular MRI scans don’t show onset of disease which disproportionately affects Ashkenazi Jews, but Hebrew University team’s peer-reviewed research says its advanced technique does
")
A new Israeli brain scan technique could lead to routine screening to diagnose cases of Parkinson’s disease at its onset, scientists say.
Pharmaceutical companies are expected to receive approvals in the coming years for drugs to treat Parkinson’s, and a major challenge for doctors is to identify early who is developing the disease and therefore who should receive the drugs.
Regular MRI scans, the usual method of visualizing brain structure, don’t show the onset of Parkinson’s as they aren’t sensitive enough.
The disease — which disproportionately affects Ashkenazi Jews — is normally diagnosed during clinical testing, in which doctors make an assessment based on symptoms rather than on the state of the brain.
There is another method, which assesses the state of the brain, but it involves injecting a radioactive substance, so it isn’t widely used because of its invasiveness and high cost.
Prof. Aviv Mezer said his team of researchers at Hebrew University in Jerusalem has developed an easy-to-scale objective method for diagnosis — one which assesses brain scans based on measurements of decay in the brain, and gives a clear yes or no answer for the presence of the disease.
The researchers have confirmed proof of concept and are working on a tool for use in clinics.
“This is very positive, as scientists prefer objective measurements like this one over the assessment of symptoms by doctors, and could very much advance diagnosis,” Mezer said.
His team used a special type of brain scan called quantitative MRI or qMRI, which provides detailed measurements from scans. They then developed an algorithm to analyze the measurements.
Using this, they were able to get the detailed information that regular MRIs have failed to yield for Parkinson’s diagnosis, namely information on changes in microstructures within the striatum, a region in the forebrain that is critical to motor function.
Previous research shows that the striatum deteriorates during the progress of Parkinson’s disease. As this region is so important in allowing people to control their muscles, it is believed to impair this ability.
While the most noticeable effects are tremors and a hunched stance, patients suffering from Parkinson’s often lose control of their primary and secondary motor skills, suffer from vision, bladder and sleep issues, and can eventually lose their memories and slip into dementia.
Mezer and colleagues set out to find a method for using qMRI imaging to detect this deterioration in its initial stages, and successfully achieved that. They reported their achievement in a peer-reviewed article published on Friday in the Science Advances journal.
“This finding can be used to develop screening tools for Parkinson’s which could help to detect the disease based on brain changes, not on symptoms,” Mezer said. “Successful intervention should be early, so this could actually make it possible to intervene more effectively.”
His lab is already working on such a tool, which he anticipates could be ready for clinical use three to five years down the line.
“Until now we haven’t had a quantitative MRI that shows the extent of decay in striatum that would indicate Parkinson’s, or a way to see it. Our research has given us both,” he said.
Click here to add your own text
Click here to add your own text
Click here to add your own text
Click here to add your own text
Click here to add your own text
Click here to add your own text
Click here to add your own text
Click here to add your own text
Click here to add your own text
Click here to add your own text
Click here to add your own text
Budget restrictions and attempts to simplify assignee management are prompting a growing number of companies to ponder this question.