
source: visualcapitalist
Crude Oil Pipelines and Refineries of the U.S. and Canada
Pipelines are the primary method of transporting crude oil around the world, delivering oil and its derivative products swiftly to refineries and empowering reliant businesses.
And North America is a major oil hub. The U.S. and Canada alone are home to more than 90,000 miles of crude oil and petroleum product pipelines, along with more than 140 refineries that can process around 20 million barrels of oil every day.
This interactive graphic uses data from Rextag to map out crude oil pipelines and refineries across the U.S. and Canada, showcasing individual pipeline diameter and daily refinery throughput.
The Longest Crude Oil Pipeline Networks in North America
Since 2010, U.S. crude oil production has more than doubled from 5.4 million barrels a day to more than 11.5 million. Meanwhile, the pipeline networks needed to transport this newly produced oil have only expanded by roughly 56%.
Today, the largest pipeline network across the U.S. and Canada (with a diameter of at least 10 inches) is the 14,919 mile network managed by Plains, which spans from the northwestern tip of Alberta all the way down to the southern coasts of Texas and Louisiana.
| Company | Length of Crude Oil Pipeline Network |
|---|---|
| Plains Pipeline LP | 14,919 miles |
| Enbridge Energy Partners LP | 12,974 miles |
| Sunoco Inc. | 6,409 miles |
| MPLX LP | 5,913 miles |
| Lotus Midstream | 5,767 miles |
Source: Rextag
Enbridge owns the next largest crude oil pipeline network, with 12,974 miles of crude oil pipelines that are at least 10 inches in diameter. The Canadian company, one of the world’s largest oil companies, transports about 30% of the crude oil produced in North America.
Following the networks of Plains and Enbridge, there’s a steep drop off in the length of pipeline networks, with Sunoco’s crude oil pipeline network spanning about half the length of Enbridge’s at 6,409 miles.
The Largest Crude Oil Refineries in North America
These various sprawling pipeline networks initially carry crude oil to refineries, where it is processed into gasoline, diesel fuel, and other petroleum products.
The refineries with the largest throughput in North America are all located in the Gulf Coast (PADD 3), with the five refineries that process more than 500,000 barrels per day all located in the states of Louisiana and Texas.
| Company | City | Refining Capacity (barrels per day) |
|---|---|---|
| Motiva Enterprises | Port Arthur, Texas | 607,000 |
| Marathon Petroleum | Galveston Bay, Texas | 585,000 |
| Marathon Petroleum | Garyville, Louisiana | 578,000 |
| ExxonMobil | Baytown, Texas | 560,000 |
| ExxonMobil | Baton Rouge, Louisiana | 518,000 |
Source: Rextag
While Texas and Louisiana have six refineries that process more than 400,000 barrels per day, there are only two other facilities outside of these states with the same kind of throughput, located in Whiting, Indiana (435,000 barrels per day) and Fort McMurray, Alberta (465,000 barrels per day).
Fort McMurray’s facility is an upgrader, which differs from refineries as it upgrades heavy oils like bitumen into lighter synthetic crude oil which flows through pipelines more easily. Many oil refineries aren’t able to directly convert bitumen, which is extracted from oil sands like those found in Alberta, making upgraders a necessary part in the production and processing of crude oil from oil sands.
The Uncertain Future of New Pipelines in North America
The development of new pipelines remains a contentious issue in Canada and the U.S., with the cancellation of the Keystone XL pipeline emblematic of growing anti-pipeline sentiment. In 2021, only 14 petroleum liquids pipeline projects were completed in the U.S., which was the lowest amount of new pipelines and expansions since 2013.
But domestic energy production is once again in the spotlight due to the U.S. ban on Russian oil imports and Russia’s impending export ban on raw materials. North American consumers are now facing surging gasoline and energy prices as foreign oil is proving to be far less reliable in times of geopolitical turmoil.
It’s important to note that pipelines are not a perfect solution, as leaks and spills in just the last decade have resulted in billions of dollars of damages. From 2010 to 2020, the Pipeline and Hazardous Materials Safety Administration recorded 983 incidents that resulted in 149,000 spilled and unrecovered barrels of oil, five fatalities, 27 injuries, and more than $2.5B in damages.
But over the past five years, liquid pipeline incidents have fallen by 21% while pipeline mileage and barrels delivered have increased by more than 27%. Along with these infrastructure improvements, pipeline developers and operators emphasize the lack of better alternatives, as freight and seaborne transportation are both far less efficient and result in more carbon emissions.
Currently, pipelines remain key components of energy consumption across the U.S. and Canada, and as global energy markets face supply squeezes, international sanctions, and geopolitical turbulence, the focus on them has grown.
Click here to add your own text
Click here to add your own text
……………
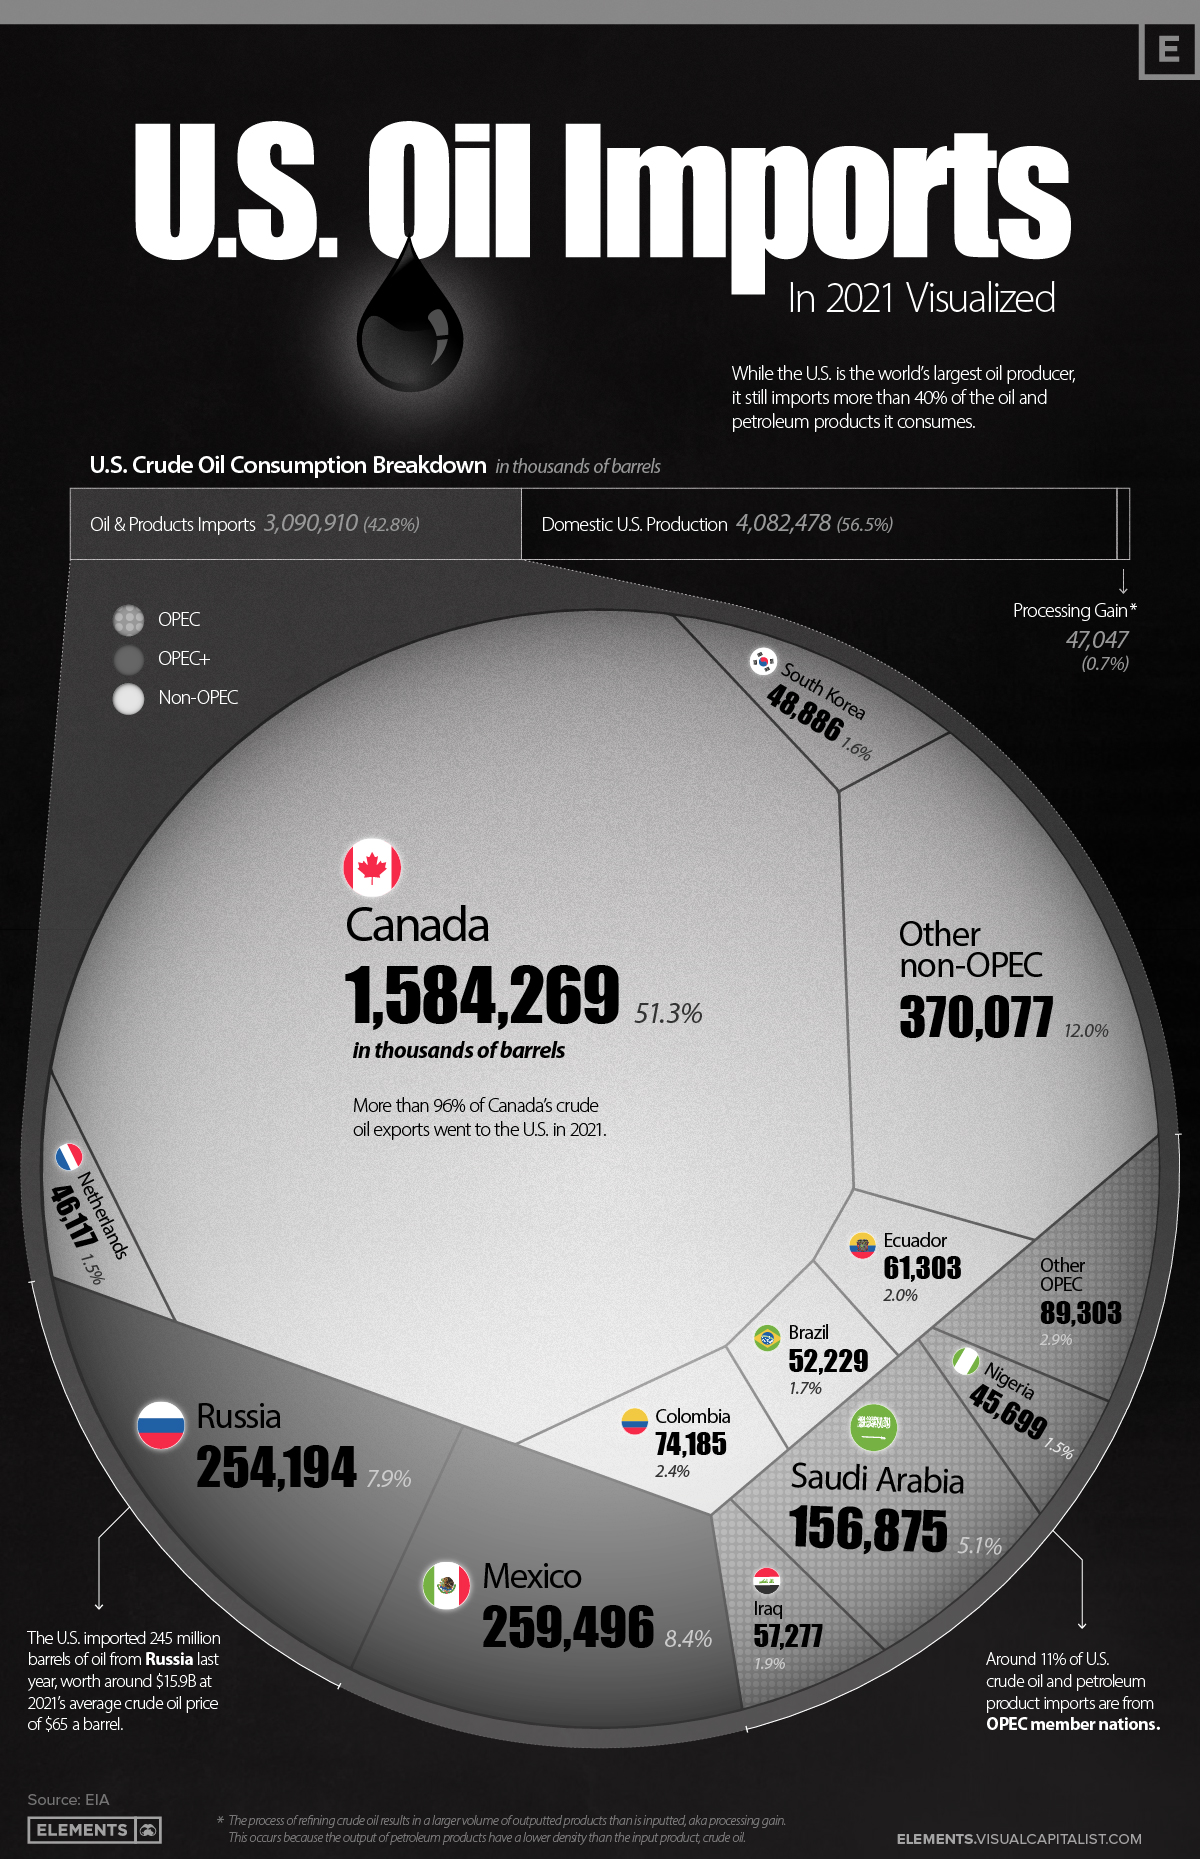
U.S. Petroleum Product and Crude Oil Imports in 2021: Visualized
This was originally posted on Elements. Sign up to the free mailing list to get beautiful visualizations on natural resource megatrends in your email every week.
Energy independence is top of mind for many nations as Russia’s invasion of Ukraine has prompted sanctions and bans against Russian coal and crude oil imports.
Despite being the world’s largest oil producer, in 2021 the U.S. still imported more than 3 billion barrels of crude oil and petroleum products, equal to 43% of the country’s consumption.
This visualization uses data from the Energy Information Administration (EIA) to compare U.S. crude oil and refined product imports with domestic crude oil production, and breaks down which countries the U.S. imported its oil from in 2021.
U.S. Crude Oil Imports, by Country
The U.S. imports more than 8 million barrels of petroleum products a day from other nations, making it the world’s second-largest importer of crude oil behind China.
America’s northern neighbor, Canada, is the largest source of petroleum imports at 1.58 billion barrels in 2021. These made up more than 51% of U.S. petroleum imports, and when counting only crude oil imports, Canada’s share rises to 62%.
| Rank | Country | U.S. Oil Imports (2021, in barrels) | Share |
|---|---|---|---|
| #1 | Canada | 1,584 million | 51.3% |
| #2 | Mexico | 259 million | 8.4% |
| #3 | Russia | 254 million | 7.9% |
| #4 | Saudi Arabia | 156 million | 5.1% |
| #5 | Colombia | 74 million | 2.4% |
| #6 | Ecuador | 61 million | 2.0% |
| #7 | Iraq | 57 million | 1.9% |
| #8 | Brazil | 52 million | 1.7% |
| #9 | South Korea | 48 million | 1.6% |
| #10 | Netherlands | 46 million | 1.5% |
| #11 | Nigeria | 45 million | 1.5% |
| Other countries | 459 million | 14.7% | |
| Total | 3,091 million | 100.0% |
The second-largest contributor to U.S. petroleum imports was another neighbor, Mexico, with 259 million barrels imported in 2021—making up a bit more than 8% of U.S. petroleum imports.
Russia was the third-largest exporter of crude oil and petroleum products to the U.S. in 2021, with their 254 million barrels accounting for almost 8% of total imports.
U.S. Crude Oil and Petroleum Imports from OPEC and OPEC+
Only about 11% of U.S. crude oil and petroleum product imports come from OPEC nations, with another 16.3% coming from OPEC+ members.
While imports from OPEC and OPEC+ members make up more than a quarter of America’s total petroleum imports, this share is fairly small when considering OPEC members currently control nearly 80% of the world’s oil reserves.
Which Countries are Part of OPEC and OPEC-Plus?
The Organization of Petroleum Exporting Countries (OPEC) is a group of 13 petroleum producing nations that formed in 1960 to provide steady prices and supply distribution of crude oil and petroleum products.
In 2016, OPEC-plus was formed with additional oil-exporting nations in order to better control global oil supply and markets in response to a deluge of U.S. shale supply hitting the markets at that time.
OPEC members:
- Iran*
- Iraq*
- Kuwait*
- Saudi Arabia*
- Venezuela*
- Algeria
- Angola
- Equatorial Guinea
- Gabon
- Libya
- Nigeria
- Republic of the Congo
- United Arab Emirates
* Founding members
OPEC+ members:
- Russia
- Mexico
- Kazakhstan
- Malaysia
- Azerbaijan
- Bahrain
- Brunei
- Oman
- Sudan
- South Sudan
Although OPEC and OPEC+ members supply a significant part of U.S. crude oil and petroleum imports, America has avoided overdependence on the group by instead building strong ties with neighboring exporters Canada and Mexico.
Crude Oil Imports Capitalize on U.S. Refineries
While the U.S. has been a net exporter of crude oil and petroleum products the past two years, exporting 3.15 billion barrels while importing 3.09 billion barrels in 2021, crude oil-only trade tells a different story.
In terms of just crude oil trade, the U.S. was a significant net importer, with 2.23 billion barrels of crude oil imports and only 1.08 billion barrels of crude oil exports. But with the U.S. being the world’s largest crude oil producer, why is this?
As noted earlier, neighboring Canada makes up larger shares of U.S. crude oil imports compared to crude oil and petroleum product imports. Similarly, Mexico reaches 10% of America’s crude oil imports when excluding petroleum products.
Maximizing imports from neighboring countries makes sense on multiple fronts for all parties due to lower transportation costs and risks, and it’s no surprise Canada and Mexico are providing large shares of just crude oil as well. With such a large collection of oil refineries across the border, it’s ultimately more cost-efficient for Canada and Mexico to tap into U.S. oil refining rather than refining domestically.
In turn, Mexico is the largest importer of U.S. produced gasoline and diesel fuel, and Canada is the third-largest importer of American-produced refined petroleum products.
Replacing Russian Crude Oil Imports
While Russia only makes up 8% of American petroleum product imports, their 254 million barrels will need to be replaced as both countries ceased trading soon after Russia’s invasion of Ukraine.
In an effort to curb rising oil and gasoline prices, in March President Joe Biden announced the release of up to 180 million barrels from the U.S. Strategic Petroleum Reserves. Other IEA nations are also releasing emergency oil reserves in an attempt to curb rising prices at the pump and volatility in the oil market.
While the U.S. and the rest of the world are still managing the short-term solutions to this oil supply gap, the long-term solution is complex and has various moving parts. From ramping up domestic oil production to replacing oil demand with other cleaner energy solutions, oil trade and imports will remain a vital part of America’s energy supply.
Click here to add your own text
WIND

Since the early 2000s, wind turbines have grown in size—in both height and blade lengths—to generate more energy per unit.
Today, the tallest turbines can reach over 200 meters (650 ft) in height and cost more than $12 million to manufacture and install.
The above infographic uses data compiled from company portfolios to showcase the biggest wind turbines currently being developed and to put these huge structures into perspective.
Blade Runners
The biggest turbines are all located over water. The so-called offshore turbines can be taller than those onshore, which means they can harness more wind energy and produce more electricity.
MingYang Smart Energy, a Chinese wind turbine manufacturer, is in the process of building the biggest wind turbine so far.
Their new MySE 16.0-242 model is still under construction and is expected to be online by 2026. It will be 264 meters tall, with a blade length 118 meters long and rotor diameter of 242 meters. It features a nameplate capacity of 16 megawatts that can power 20,000 homes per unit over a 25-year service life. The first commercial turbine will be installed at the MingYang Yangjiang Qingzhou Four offshore wind farm, which is in the South China Sea.
Here are four of the biggest wind turbine models on the market right now, the companies that are making them, and where the prototypes are being installed:
| Model | Company | Nameplate capacity (MW) | Location | Height (m) | Blade Length (m) | Rotor Diameter (m) |
|---|---|---|---|---|---|---|
| MySE 16.0-242 | MingYang Smart Energy | 16 MW | 264 | 118 | 242 | |
| SG 14-236 DD | Siemens Gamesa | 14 MW | Site Specific | 115 | 236 | |
| Haliade-X | General Electric | 14 MW | 260 | 107 | 220 | |
| V236-15.0 | Vestas | 15 MW | 280 | 116 | 236 |
These huge structures can be two times taller than a typical turbine currently in operation, generating almost four times more energy.
Prototypes for two of the top four turbine models—the SG 14-236 DD and V236-15.0— are scheduled to be installed in 2022 in Denmark, a country that was a pioneer in developing commercial wind power during the 1970s, and is home to the world’s largest wind-turbine manufacturer, Vestas.
From our list, General Electric’s Haliade-X is the only turbine currently online; the prototype has been operating since October 2021 in the Netherlands.
Wind Energy’s Rapid Global Growth
Wind generated 6.6% of the world’s electricity in 2021, up from 3.5% in 2015, when the Paris Agreement was signed, making it the fastest-growing source of electricity after solar.
A number of countries have achieved relatively high levels of wind energy penetration in their electricity grids.
Wind’s share of electricity generation was nearly 50% in Denmark and sits above 25% in countries such as Ireland, Uruguay, and Portugal. In the United States, wind supplied 8.4% of total electricity generation.
| Country | Wind Share of Electricity (%) |
|---|---|
| Denmark | 48% |
| Uruguay | 43% |
| Ireland | 33% |
| Portugal | 27% |
| Spain | 23% |
| United Kingdom | 21% |
| Germany | 20% |
| Greece | 20% |
| Kenya | 16% |
| Sweden | 16% |
Source: Ember’s Global Electricity Review 2022
Note: Countries with populations fewer than 3 million in 2021 were not included in this ranking.
The global wind turbine market size was valued at $53.4 billion in 2020 and is projected to reach $98.4 billion by 2030, growing at a CAGR of 6.3%.
As one of the fastest-growing segments of the energy sector, wind energy generation will continue to grow as wind turbines also scale up in size.
Click here to add your own text
Click here to add your own text
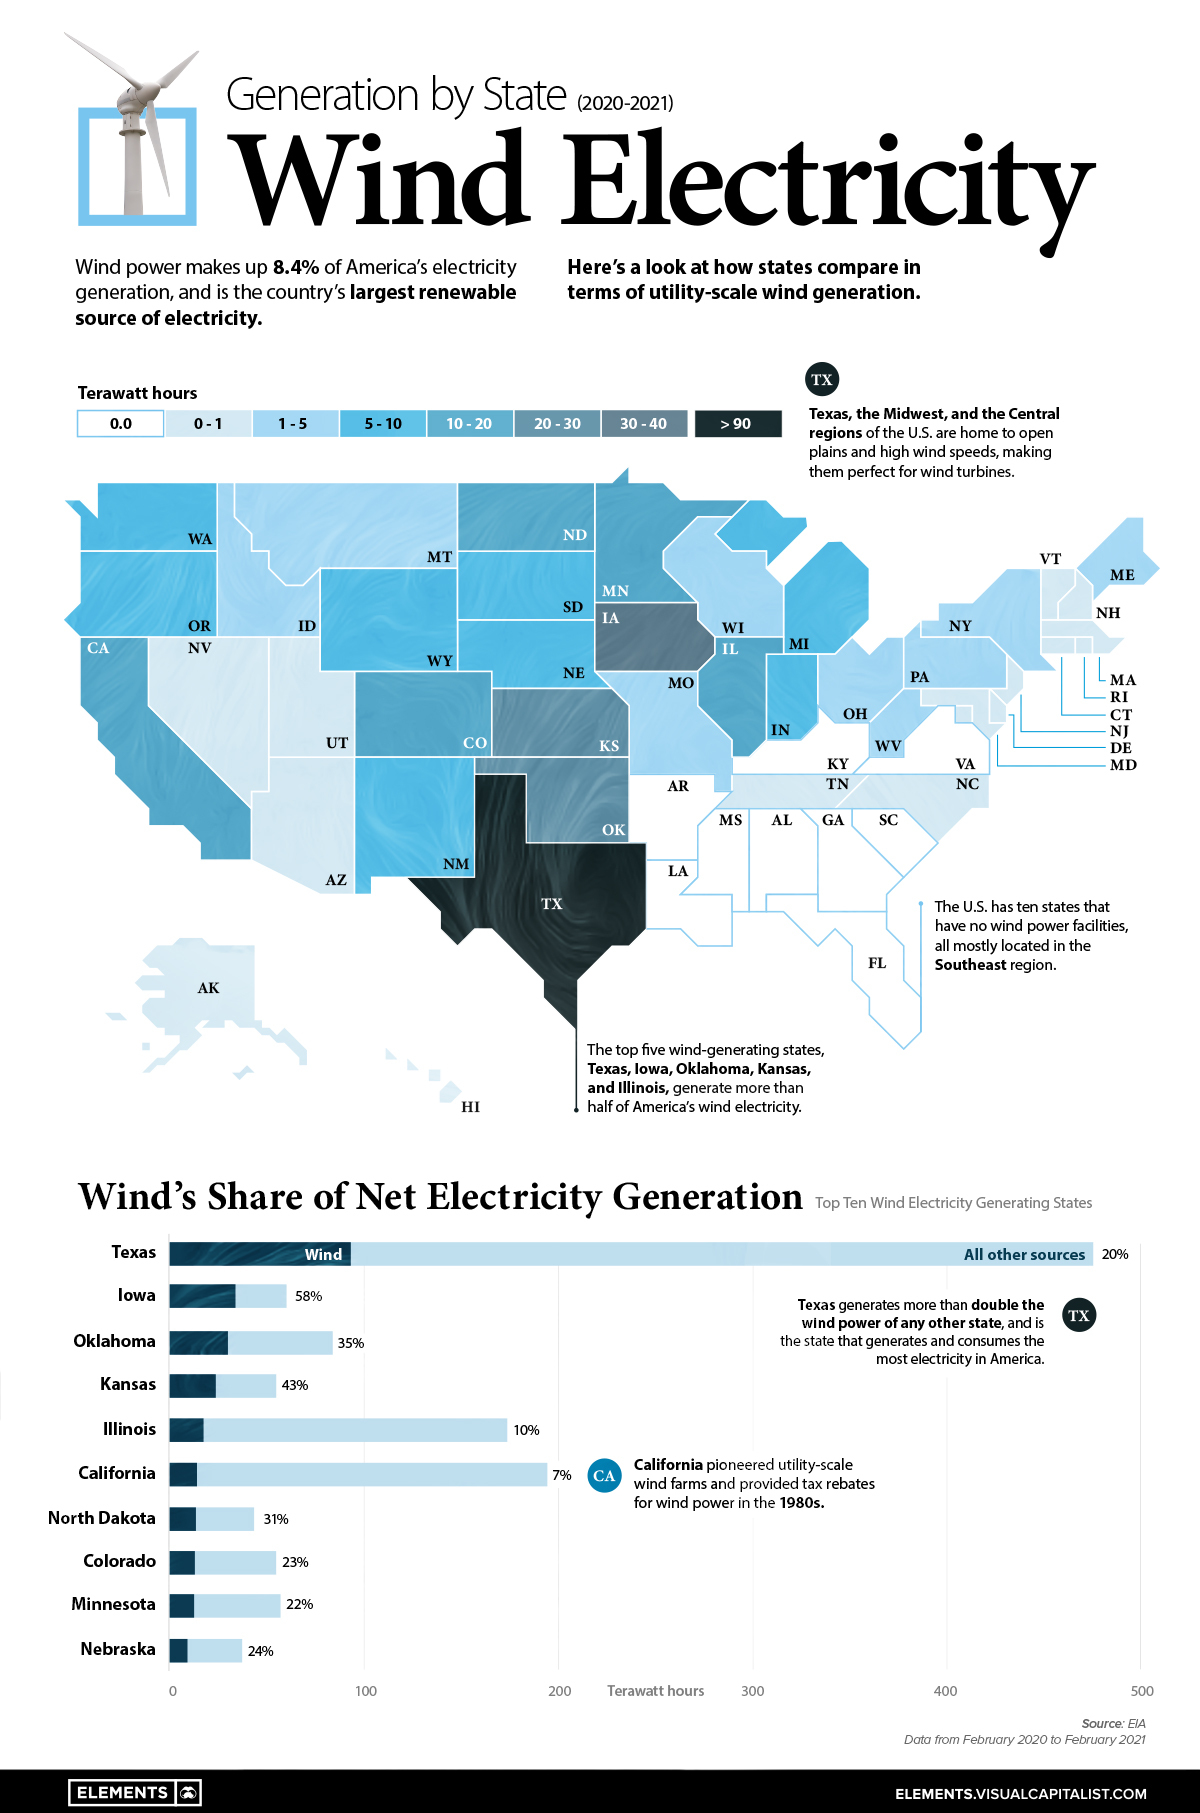
Wind Electricity Generation by State Compared
America’s wind energy generating states are all primarily located in the Central and Midwest regions of the nation, where wind speeds are highest and most consistent.
Texas is the runaway leader in wind, generating over 92 Terawatt-hours of electricity during a year, more than the next three top states (Iowa, Oklahoma, and Kansas) combined. While Texas is the top generator in terms of wind-powered electricity, wind only makes up 20% of the state’s total electricity generation.
| State | Wind Electricity Generation (Terawatt hours) | Wind’s Share of Net Electricity Generation |
|---|---|---|
| Texas | 92.9 TWh | 20% |
| Iowa | 34.1 TWh | 58% |
| Oklahoma | 29.6 TWh | 35% |
| Kansas | 23.5 TWh | 43% |
| Illinois | 17.1 TWh | 10% |
| California | 13.6 TWh | 7% |
| North Dakota | 13.2 TWh | 31% |
| Colorado | 12.7 TWh | 23% |
| Minnesota | 12.2 TWh | 22% |
| Nebraska | 8.7 TWh | 24% |
Data from Feb 2020-Feb 2021
Source: EIA
Meanwhile, wind makes up a much larger share of net electricity generation in states like Iowa (58%), Oklahoma (35%), and Kansas (43%). For both Iowa and Kansas, wind is the primary energy source of in-state electricity generation after overtaking coal in 2019.
The U.S. also has 10 states with no wind power generating facilities, all primarily located in the Southeast region.
How Does Wind Energy Work?
Humans have been harnessing wind power for millennia, with windmills originally relying on wind to pump water or mill flour.
Today’s wind turbines work similarly, with their large blades generating electricity as wind causes them to rotate. As these blades are pushed by the wind, a connected internal shaft that is attached to an electric generator also turns and generates electricity.
Wind power is one of the safest sources of energy and relies on one key factor: wind speeds. When analyzing minimum wind speeds for economic viability in a given location, the following annual average wind speeds are needed:
- Small wind turbines: Minimum of 4 meters per second (9 miles per hour)
- Utility-scale wind turbines: Minimum of 5.8 meters per second (13 miles per hour)
Source: EIA
Unsurprisingly, the majority of America’s onshore wind turbine infrastructure is located in the middle of the nation, where wind speeds are highest.
Growing America’s Wind Turbine Capacity
While wind energy only made up 0.2% of U.S. electricity generating capacity in 1990, it is now essential for the clean energy transition. Today, wind power makes up more than 10% of U.S. electricity generating capacity, and this share is set to continue growing.
Record-breaking wind turbine installations in 2020 and 2021, primarily in the Central and Midwest regions, have increased U.S. wind energy generation by 30% to 135.1 GW.
In 2020, the U.S. increased wind turbine capacity by 14.2 gigawatts, followed by another 17.1 gigawatts in 2021. This year is set to see another 7.6 GW come online, with around half of 2022’s added capacity located in Texas.
After two years of record-breaking wind turbine installations, 2021’s expiration of the U.S. production tax credit is likely to dampen the rate of future installations.
Click here to add your own text
Solar / Wind Power by Country
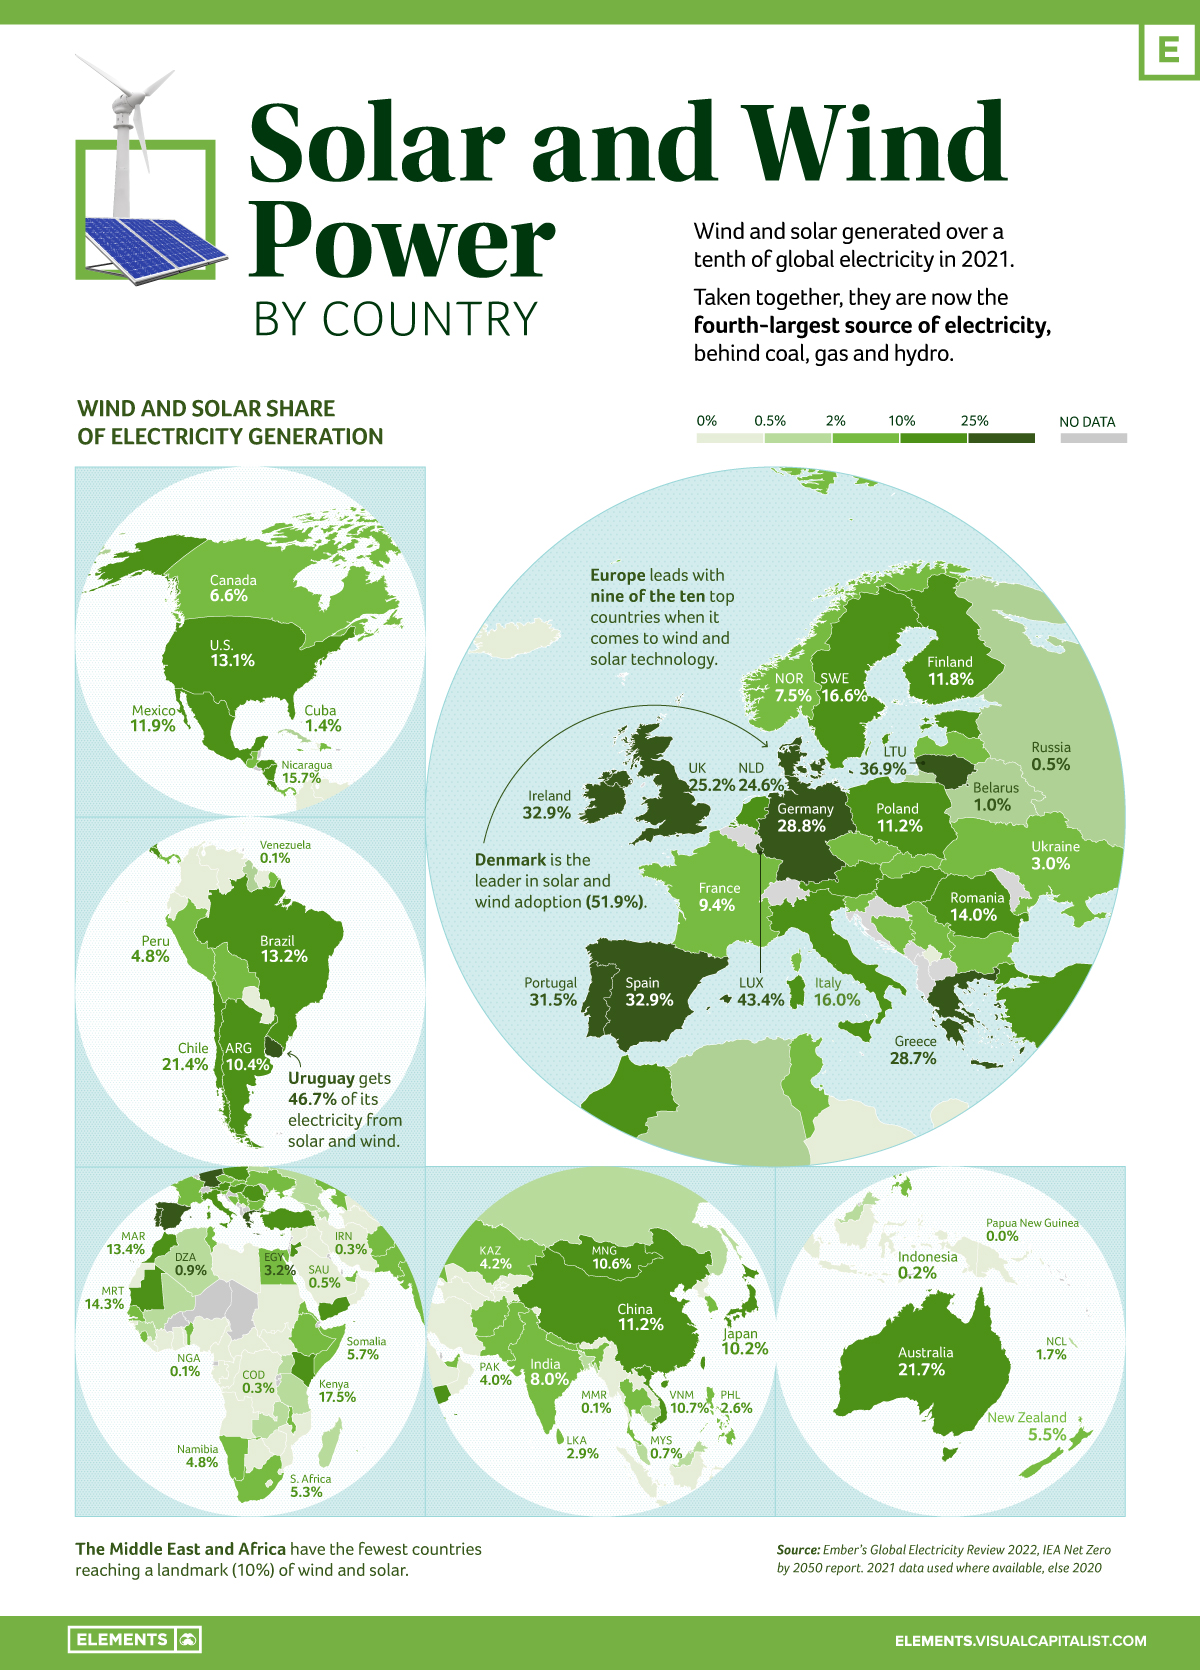
Wind and solar generate over a tenth of the world’s electricity. Taken together, they are the fourth-largest source of electricity, behind coal, gas, and hydro.
This infographic based on data from Ember shows the rise of electricity from these two clean sources over the last decade.
Europe Leads in Wind/Solar
Wind and solar generated 10.3% of global electricity for the first time in 2021, rising from 9.3% in 2020, and doubling their share compared to 2015 when the Paris Climate Agreement was signed.
In fact, 50 countries (26%) generated over a tenth of their electricity from wind and solar in 2021, with seven countries hitting this landmark for the first time: China, Japan, Mongolia, Vietnam, Argentina, Hungary, and El Salvador.
Denmark and Uruguay achieved 52% and 47% respectively, leading the way in technology for high renewable grid integration.
| Rank | Top Countries | Solar/Wind Power Share |
|---|---|---|
| #1 | 🇩🇰 Denmark | 51.9% |
| #2 | 🇺🇾 Uruguay | 46.7% |
| #3 | 🇱🇺 Luxembourg | 43.4% |
| #4 | 🇱🇹 Lithuania | 36.9% |
| #5 | 🇪🇸 Spain | 32.9% |
| #6 | 🇮🇪 Ireland | 32.9% |
| #7 | 🇵🇹 Portugal | 31.5% |
| #8 | 🇩🇪 Germany | 28.8% |
| #9 | 🇬🇷 Greece | 28.7% |
| #10 | 🇬🇧 United Kingdom | 25.2% |
From a regional perspective, Europe leads with nine of the top 10 countries. On the flipside, the Middle East and Africa have the fewest countries reaching the 10% threshold.
Further Renewables Growth Needed to meet Global Climate Goals
The electricity sector was the highest greenhouse gas emitting sector in 2020.
According to the International Energy Agency (IEA), the sector needs to hit net zero globally by 2040 to achieve the Paris Agreement’s goals of limiting global heating to 1.5 degrees. And to hit that goal, wind and solar power need to grow at nearly a 20% clip each year to 2030.
Despite the record rise in renewables, solar and wind electricity generation growth currently doesn’t meet the required marks to reach the Paris Agreement’s goals.
In fact, when the world faced an unprecedented surge in electricity demand in 2021, only 29% of the global rise in electricity demand was met with solar and wind.
Transition Underway
Even as emissions from the electricity sector are at an all-time high, there are signs that the global electricity transition is underway.
Governments like the U.S., Germany, UK, and Canada are planning to increase their share of clean electricity within the next decade and a half. Investments are also coming from the private sector, with companies like Amazon and Apple extending their positions on renewable energy to become some of the biggest buyers overall.
More wind and solar are being added to grids than ever, with renewables expected to provide the majority of clean electricity needed to phase out fossil fuels.