
The Top 25 Countries Receiving the Most U.S. Immigration Visas
Although many Americans feel that their country is on the wrong track, this does not stop foreigners from wanting to move to the United States. For many around the globe, the promise of the American dream is still worth the permanent move and hundreds of thousands of people every year apply for their U.S. immigration visas.
The ranking uses annual data from the U.S. Department of State’s Bureau of Consular Affairs to visualize the countries whose citizens are receiving the highest number of U.S. immigrant visas.
U.S. Immigration Processes
The process of U.S. immigration is confusing at best, but it always starts with a visa. A visa, in the context of immigration, is essentially a permit to enter the country, issued to those looking to work and live in the United States. There are two visa categories: immigrant and non-immigrant.
Non-immigrant visas
These visas are typically for temporary workers, but also serve other purposes, like basic travel for tourists from certain countries. Even when obtained for work purposes however, non-immigrant visas expire and do not lead to green cards or citizenship.
Some examples of non-immigrant visas categories include: members of the press, diplomatic representatives, foreign military personnel stationed in the U.S., athletes, and a plethora of other unique situations. The popular, and nearly unattainable, H-1B visas are actually non-immigrant visas.
Immigrant visas
Immigrant visas, on the other hand, can either be employment-based or family-based. The intention behind them is that they will eventually lead to permanent status in the U.S., either through green cards or citizenship. A common example of an immigration visa is the K-1 visa or the “fiancé visa” for individuals marrying American citizens.
Who’s Getting U.S. Immigrant Visas?
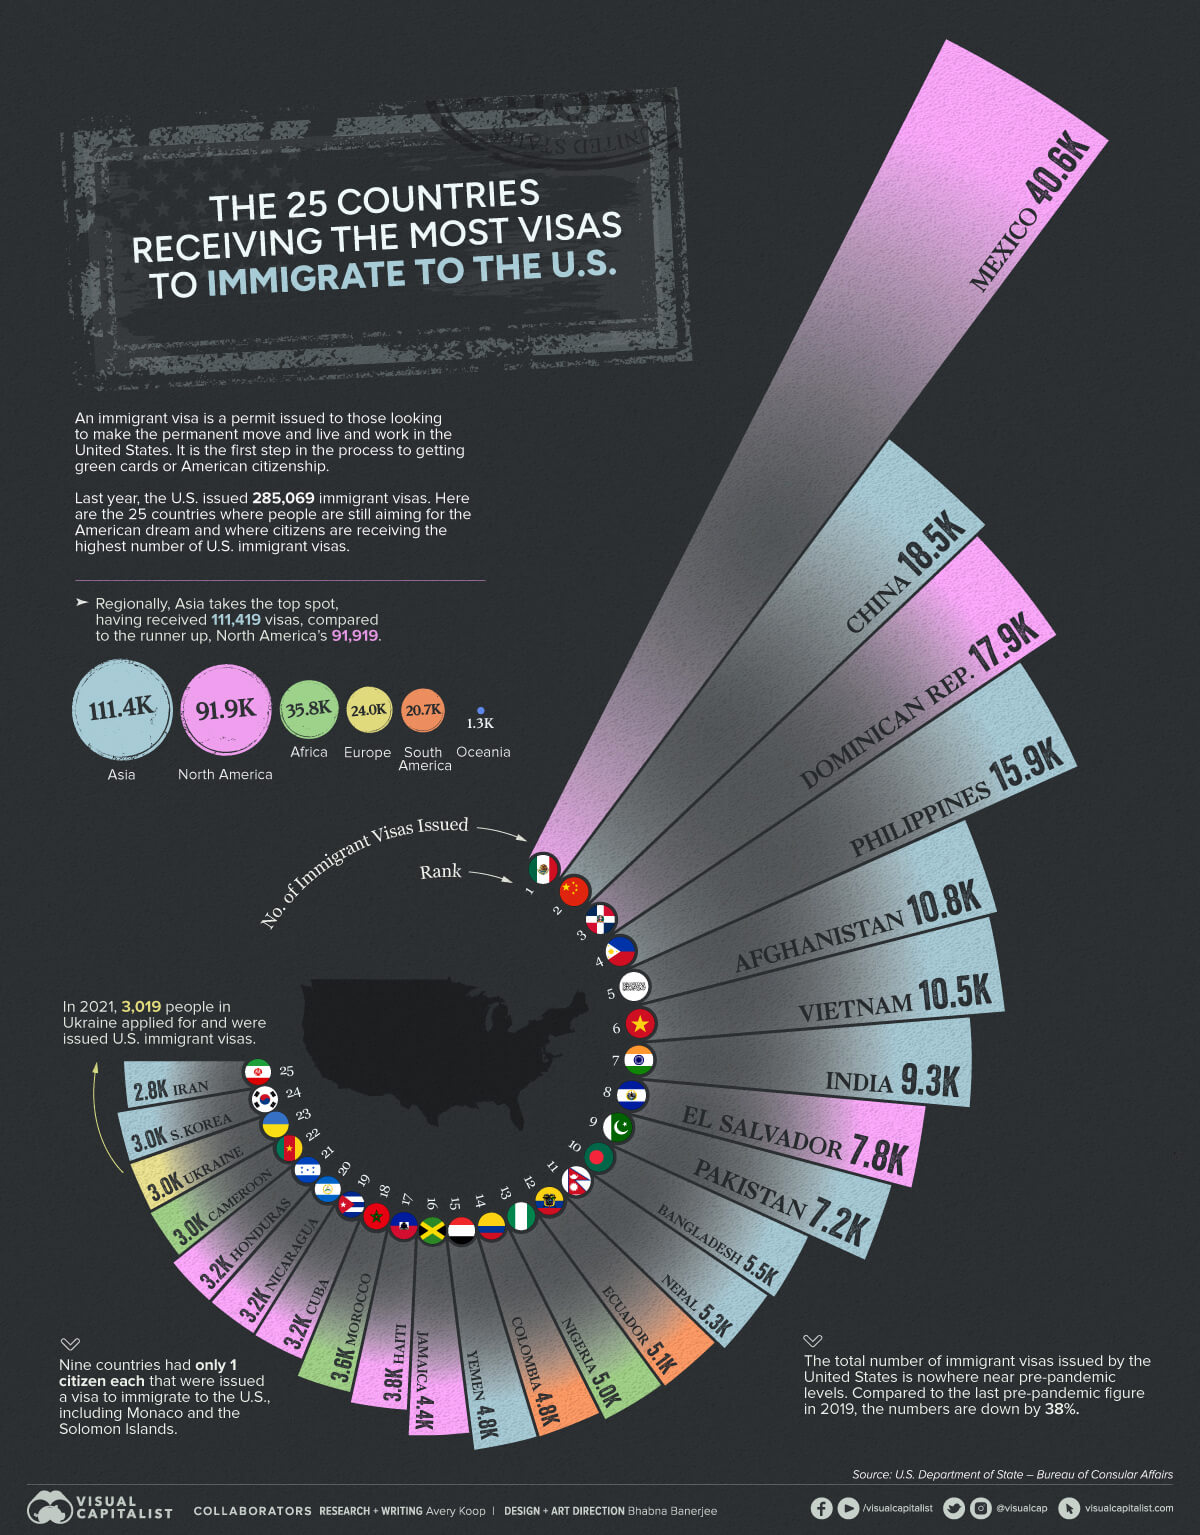
Last year, more than 285,000 U.S. immigrant visas were issued. Here’s a look how that is distributed across every country worldwide:
| Rank | Country | Immigrant Visas Issued (2021) |
|---|---|---|
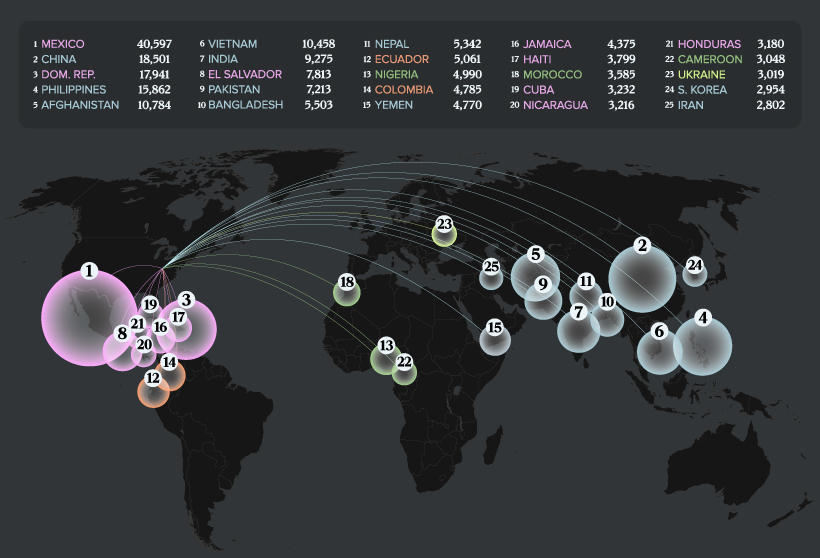
| #1 | 🇲🇽 Mexico | 40,597 |
| #2 | 🇨🇳 China | 18,501 |
| #3 | 🇩🇴 Dominican Republic | 17,941 |
| #4 | 🇵🇭 Philippines | 15,862 |
| #5 | 🇦🇫 Afghanistan | 10,784 |
| #6 | 🇻🇳 Vietnam | 10,458 |
| #7 | 🇮🇳 India | 9,275 |
| #8 | 🇸🇻 El Salvador | 7,813 |
| #9 | 🇵🇰 Pakistan | 7,213 |
| #10 | 🇧🇩 Bangladesh | 5,503 |
| Total | 285,069 |
Mexican citizens received the highest number of visas to immigrate permanently to the U.S. at nearly 40,600. America’s other neighbor, Canada, ranked 43rd, only receiving 1,464 visas. China and India also rank high on the list, ranking at #2 and #7 respectively.
Interestingly, only one European country, Ukraine, made the top 25. In 2021, prior to the Russian invasion, Ukrainians obtained 3,019 visas. A number of the top visa recipient nations are marked by violence and political unrest, like Afghanistan (#5) and Iran (#25).
Looking beyond the top 25, one surprising find is that eight North Korean citizens received immigration visas last year. Additionally, a number of countries only received a handful of U.S. immigrant visas including Luxembourg’s two, and Timor-Leste’s one.
Regionally, the bulk of the highest ranking countries are located in Asia.
Here’s a breakdown:
| Rank | Region | Immigrant Visas Issued (2021) |
|---|---|---|
| #1 | Asia | 111,419 |
| #2 | North America | 91,919 |
| #3 | Africa | 35,776 |
| #4 | Europe | 23,972 |
| #5 | South America | 20,688 |
| #6 | Oceania | 1,295 |
Finally, here’s the geographical distribution of persons receiving U.S. immigrant visas.
The State of U.S. Immigration
Around 15% of the U.S. population is made up of immigrants, and the country is home to the highest number of total immigrants in the world, at 50.6 million.
In terms of how many visas are issued annually, there is a federal ceiling of 700,000 and certain countries have their own specific caps on how many their citizens can receive, as mandated by the United States. Although the numbers change drastically year by year, they have not come close to the limit in the last decade.
Here’s a look at the total U.S. immigrant visa issuances globally. Notably, they diminished by almost half during the pandemic:
| Year | Immigrant Visas Issued Worldwide | % Change Year-over-Year |
|---|---|---|
| 2012 | 482,300 | – |
| 2013 | 473,115 | -1.9% |
| 2014 | 467,370 | -1.2% |
| 2015 | 531,463 | +13.7% |
| 2016 | 617,752 | +16.2% |
| 2017 | 559,536 | -9.4% |
| 2018 | 533,557 | -4.6% |
| 2019 | 462,422 | -13.3% |
| 2020 | 240,526 | -48.0% |
| 2021 | 285,069 | +18.5% |
Overall, whether for economic purposes, reunification of families, or in fleeing from danger, people are continuing to come to the United States.
In the period between 2016 and 2060, it’s expected that the share of the U.S. population that is American-born is going to grow by 20%. Meanwhile, the share of the population that is foreign-born is expected to jump by 58%.