

![]()
![]()
SPONSORED BY
IN THIS TRANSFORMATIVE ERA WE ARE WORKING IN… learn from
Today discussing DELEGATING and FEEDBACK and COACHING and MENTORING
CLICK and watch
I Q is "visual" news & info; become a cosponsor...show your logo to the world of business leaders Learning more about ENERGY RESOURCES, NATURAL RESOURCES Special Talent required, worldwide Let’s discuss talent development, coaching and mentoring Sponsor IQ in April @ $199 ... show the world your brand message
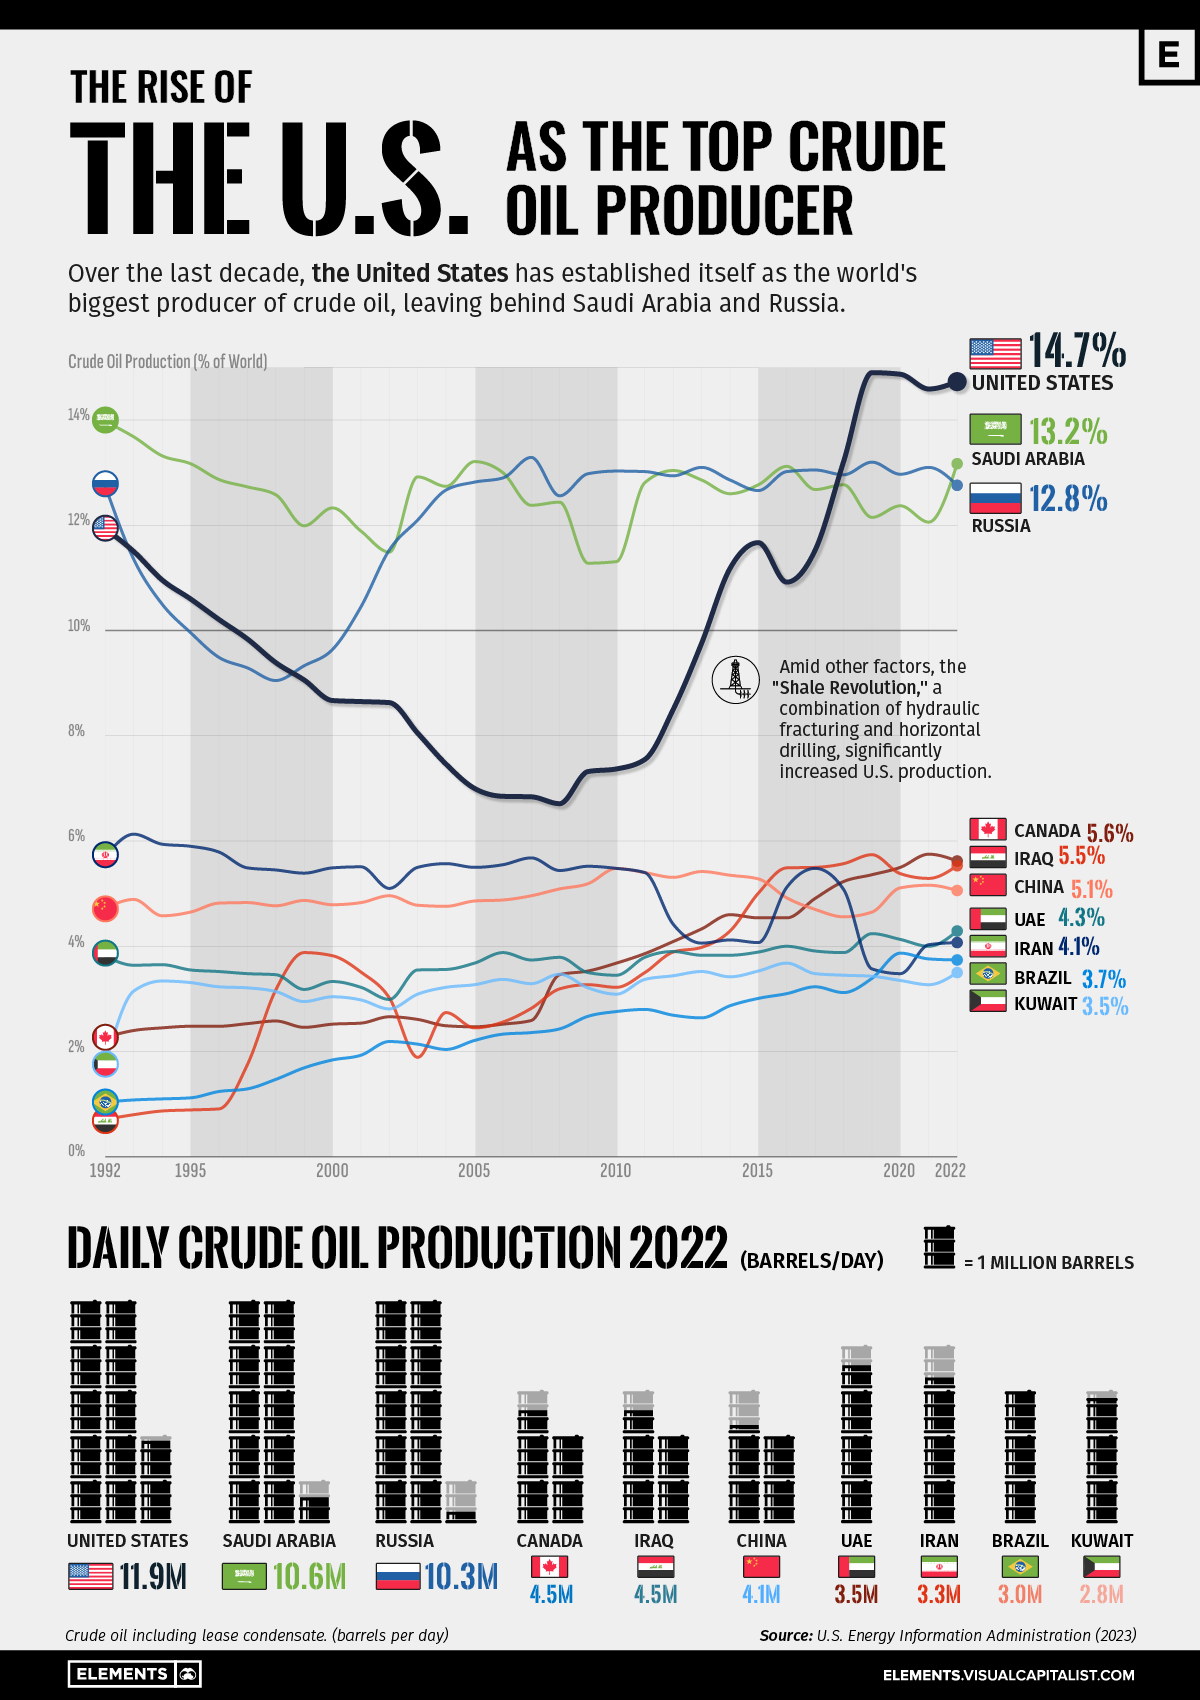
Visualizing the Rise of the U.S. as Top Crude Oil Producer
Over the last decade, the United States has established itself as the world’s top producer of crude oil, surpassing Saudi Arabia and Russia.
This infographic illustrates the rise of the U.S. as the biggest oil producer, based on data from the U.S. Energy Information Administration (EIA).
U.S. Takes Lead in 2018
Over the last three decades, the United States, Saudi Arabia, and Russia have alternated as the top crude producers, but always by small margins.
During the 1990s, Saudi Arabia dominated crude production, taking advantage of its extensive oil reserves. The petroleum sector accounts for roughly 42% of the country’s GDP, 87% of its budget revenues, and 90% of export earnings.
However, during the 2000s, Russia surpassed Saudi Arabia in production during some years, following strategic investments in expanding its oil infrastructure. The majority of Russia’s oil goes to OECD Europe (60%), with around 20% going to China.
Over the 2010s, the U.S. witnessed an increase in domestic production, much of it attributable to hydraulic fracturing, or “fracking,” in the shale formations ranging from Texas to North Dakota. It became the world’s largest oil producer in 2018, outproducing Russia and Saudi Arabia.
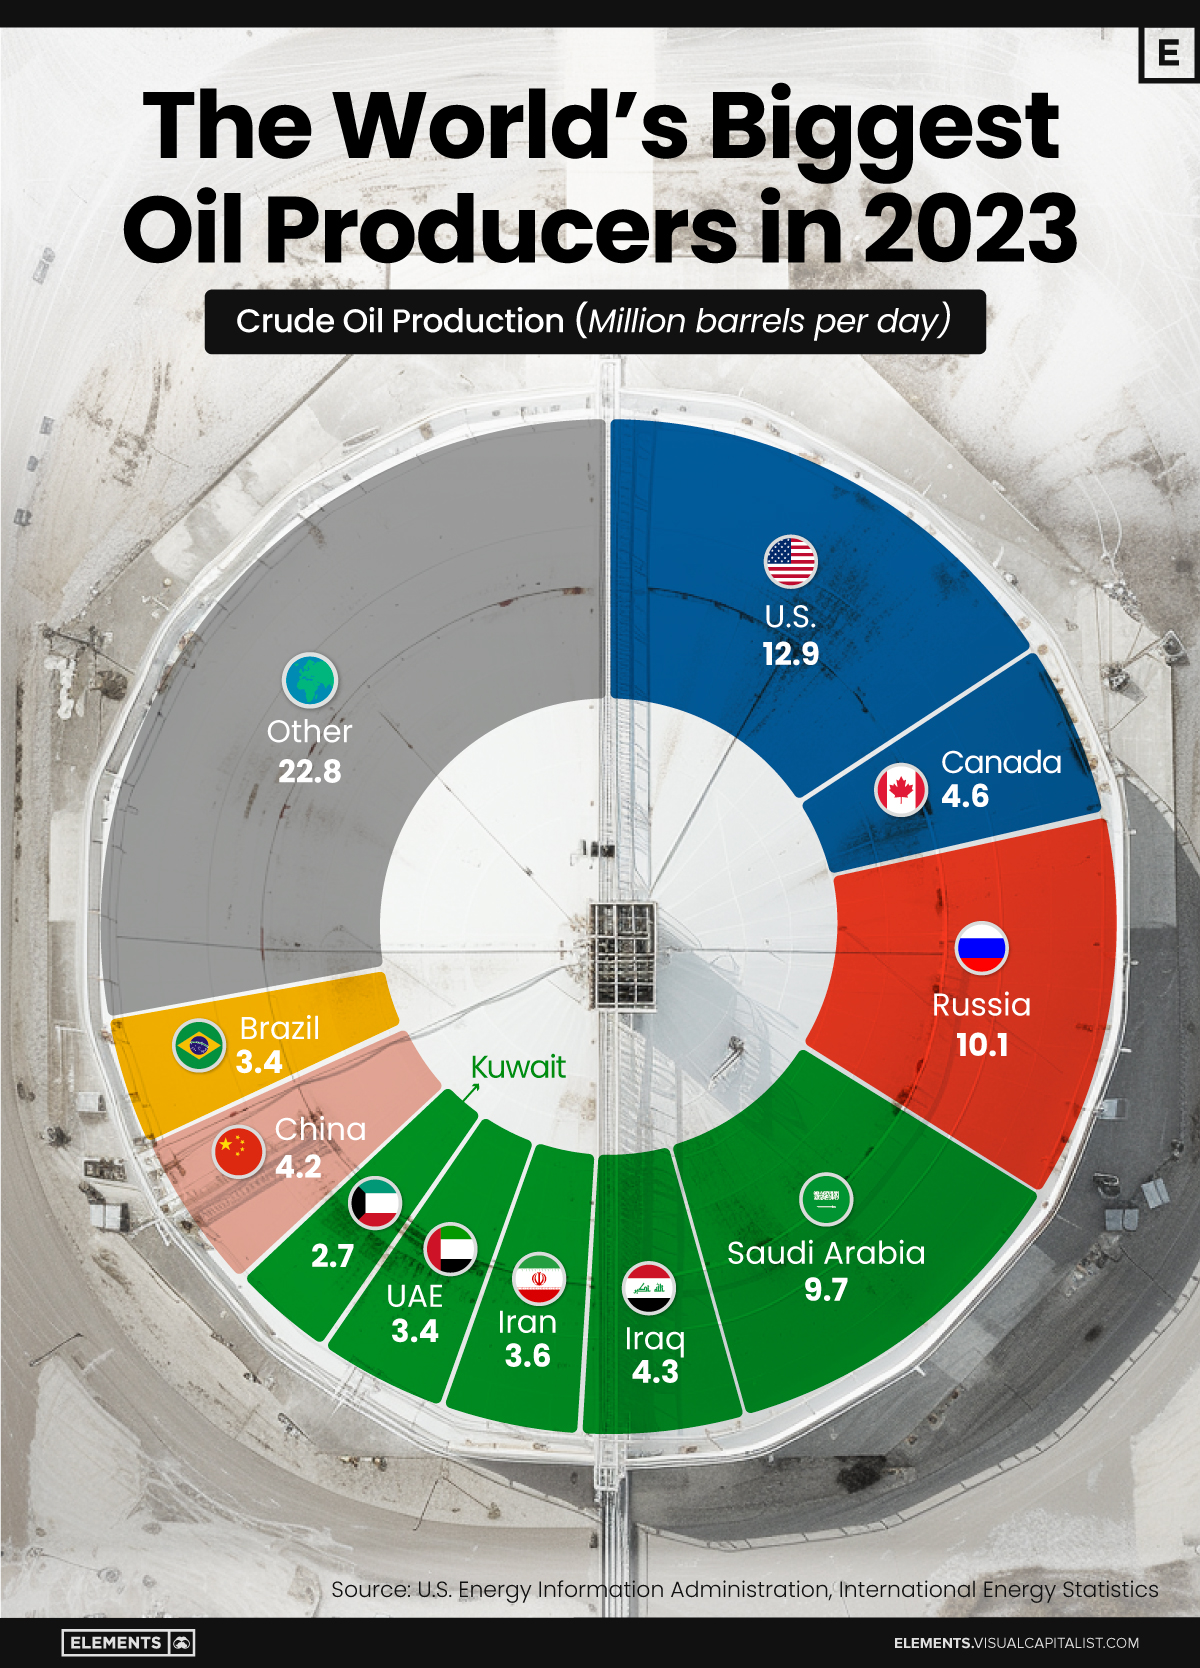
The U.S. accounted for 14.7% of crude oil production worldwide in 2022, compared to 13.1% for Saudi Arabia and 12.7% for Russia.
Despite leading petroleum production, the U.S. still trails seven countries in remaining proven reserves underground, with 55,251 million barrels.
Venezuela has the biggest reserves with 303,221 million barrels. Saudi Arabia, with 267,192 million barrels, occupies the second spot, while Russia is seventh with 80,000 million barrels.
source: ELEMENTS
Extracting a Solution
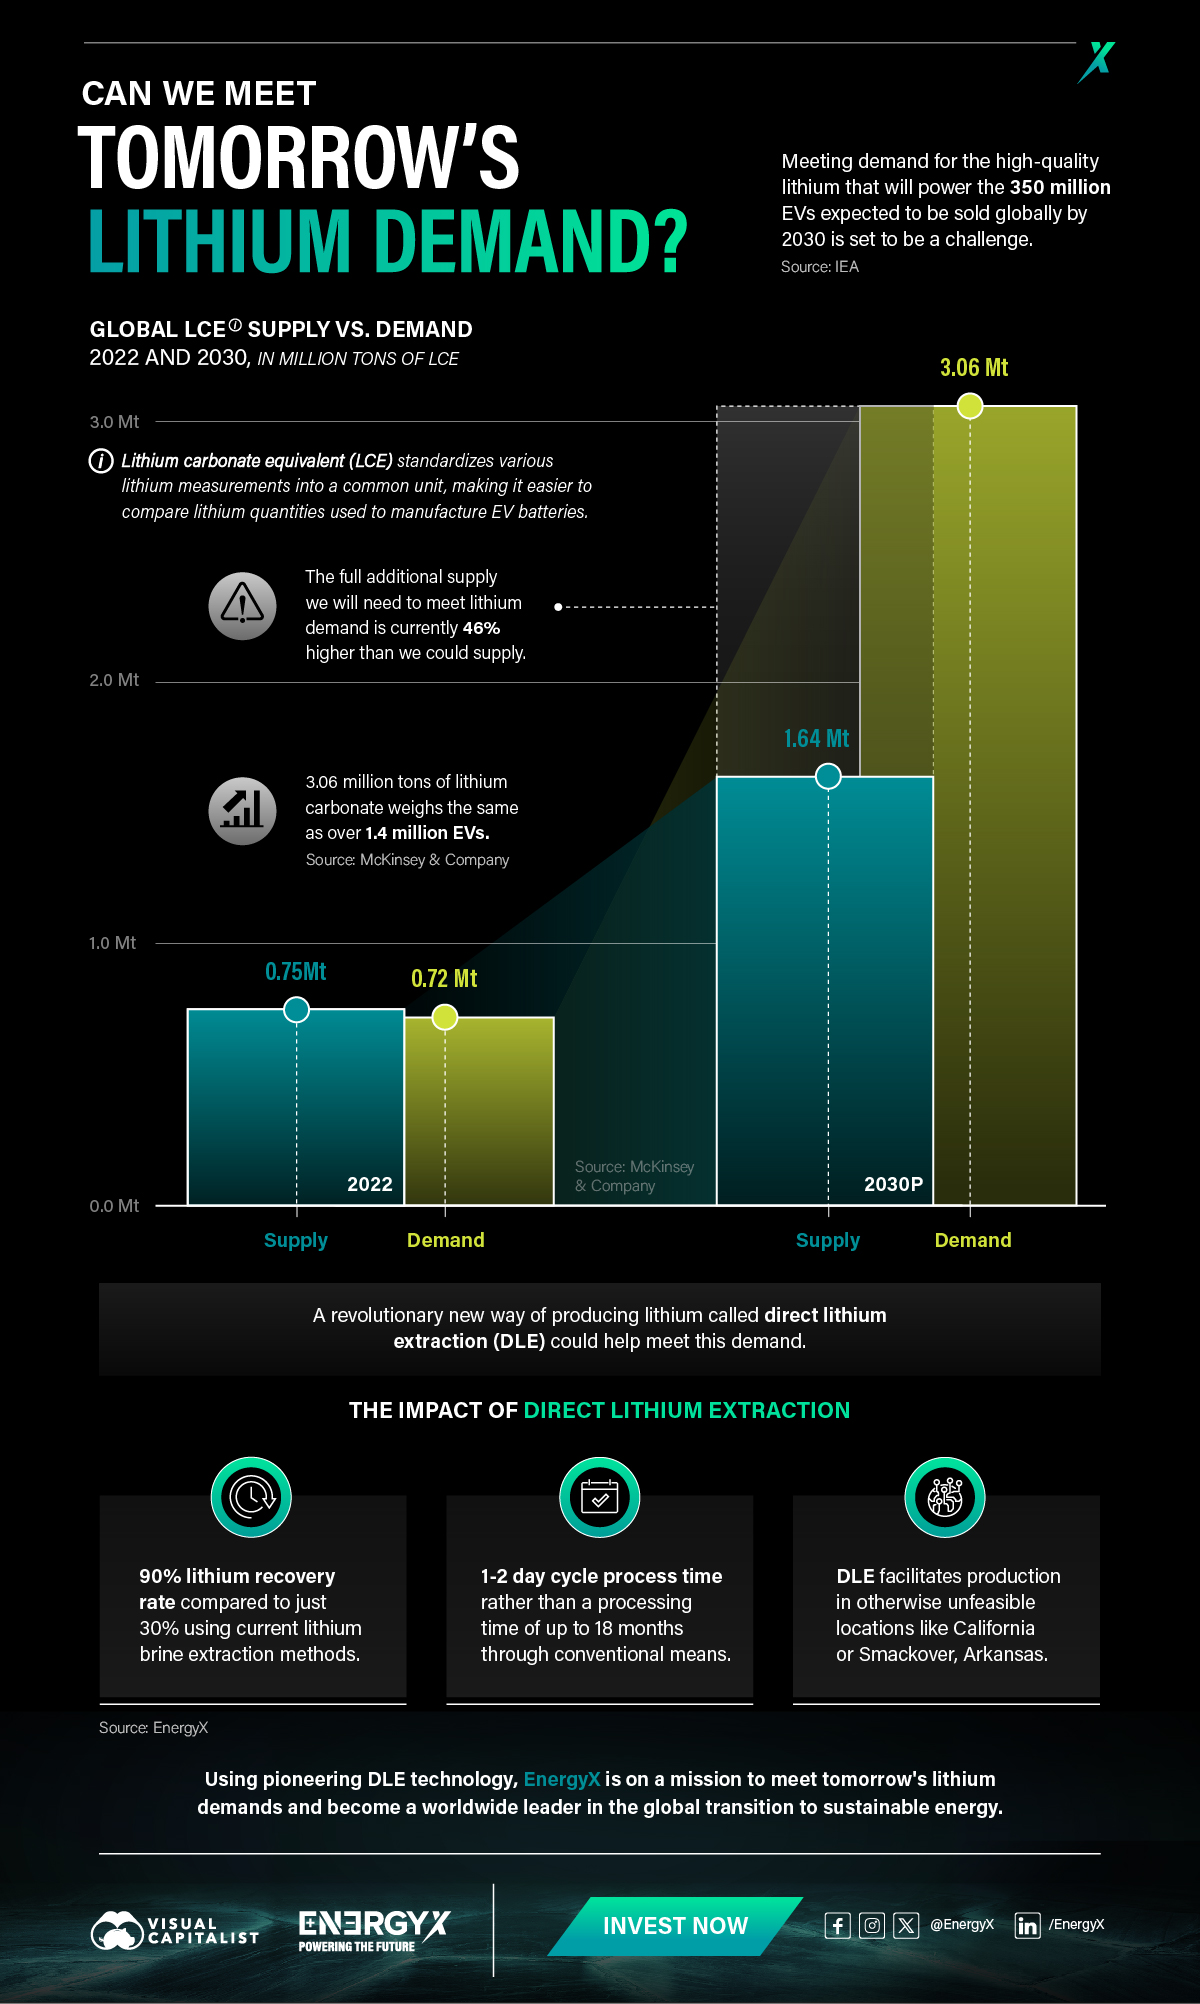
One of the main reasons why lithium demand is set to outstrip supply so aggressively is that conventional methods of extracting lithium are slow, outdated, and often cause environmental harm. However, a new way of lithium extraction, called direct lithium extraction (DLE), could resolve the supply problem.
DLE boasts a lithium recovery rate of 90%, surpassing conventional processes by 300%. This process also allows for lithium extraction from previously untapped sources, including California and the Smackover region in Arkansas.
Additionally, DLE is exceptionally efficient, taking only two days to process a lithium deposit, a process which would typically take 18 months. This process is also more environmentally friendly as producing one ton of lithium conventionally requires over 2.2 million liters of fresh water, whereas DLE requires minimal quantities.
A Path Forward
Without action, by 2030 there won’t be enough lithium to meet the combined demands of the clean energy transition and the UN’s sustainable development goals.
However, advances in DLE by pioneering companies like EnergyX could help meet the demand and ensure the transition to a more sustainable future.
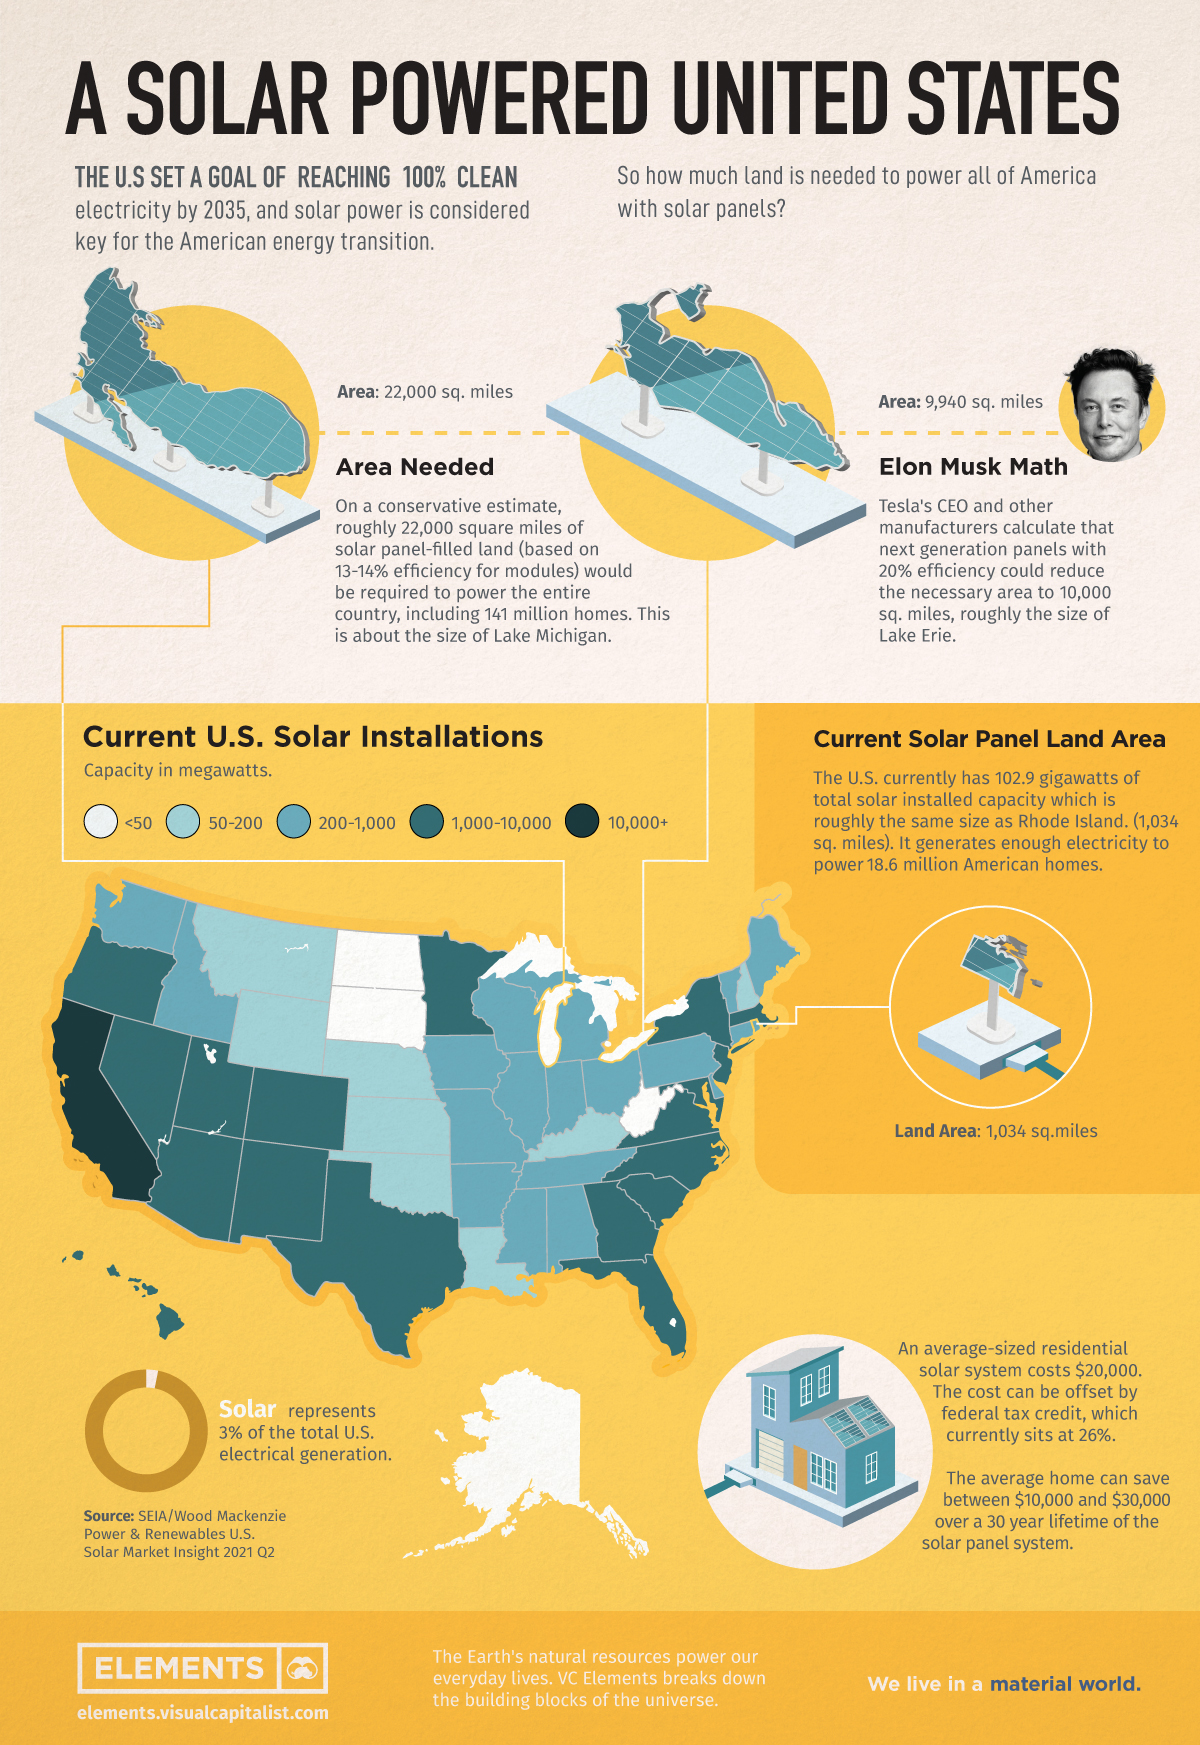
How Much Land is Needed to Power the U.S. with Solar?
The Biden administration has set a goal of reaching 100% clean electricity throughout the U.S. by 2035, and solar power is a key for this American energy transition.
In the last decade alone, solar has experienced an average annual growth rate of 42% in the U.S. thanks to federal tax credits, declining costs, and increasing demand. It is projected that more than one in seven American homes will have a solar power system by 2030.
To put this trend into perspective, this graphic uses data from the United States Department of Energy to see how much land would be needed to power the entire country with solar panels.
Solar Panels Across the Ocean State
The U.S. has 102.9 gigawatts of total solar installed capacity which is equivalent to 965 square miles, roughly the size of the country’s smallest state, Rhode Island. This current solar capacity generates enough electricity to power 18.6 million American homes, which is nearly 13% of the nation’s households.
According to a report from the National Renewable Energy Laboratory, roughly 22,000 square miles of solar panel-filled land (about the size of Lake Michigan) would be required to power the entire country, including all 141 million households and businesses, based on 13-14% efficiency for solar modules.
Many solar panels, however, reach 20% efficiency, which could reduce the necessary area to just about 10,000 square miles, equivalent to the size of Lake Erie.
Solar Installations Spreading Across the States
Today, solar represents only 3% of the total U.S. electrical generation.
While California has traditionally dominated the market, other states like Florida and Texas are expanding rapidly, boosted by the residential market.
Large companies with clean energy goals such as Walmart, Apple, Target and Amazon have also helped push solar adoption to near-record levels in 2021.

Despite having a high installation cost, the technology tends to bring savings in the long term. An average-sized residential system has dropped from a price of $40,000 in 2010 to roughly $20,000 in 2020. Along with this, solar panels can save between $10,000-$30,000 over a 30-year lifetime.
Between land and rooftops, the United States has more than enough space to build all the solar panels necessary to power the country. Until then, the future of clean electricity will also depend on hydro, nuclear, geothermal, and wind energy.
AUDIENCE VIEWS IMPRESSIONS
SOURCE: LinkedIn
Not included: readership/audience reach via youtube, facebook, instagram, google search
20,920 28 DAYS, FEB 27 – MAR 24
73,319 90 DAYS, DEC 27 – MAR 24
313,220 365 DAYS, MAR 27’23 – MAR 24’24

![]()

![]()

Click here to see what’s on
GLOBALTVtalkshow right now