


 The residential real estate market in the U.S. stands as one of the largest asset classes in the country, worth $47.5 trillion in 2023.
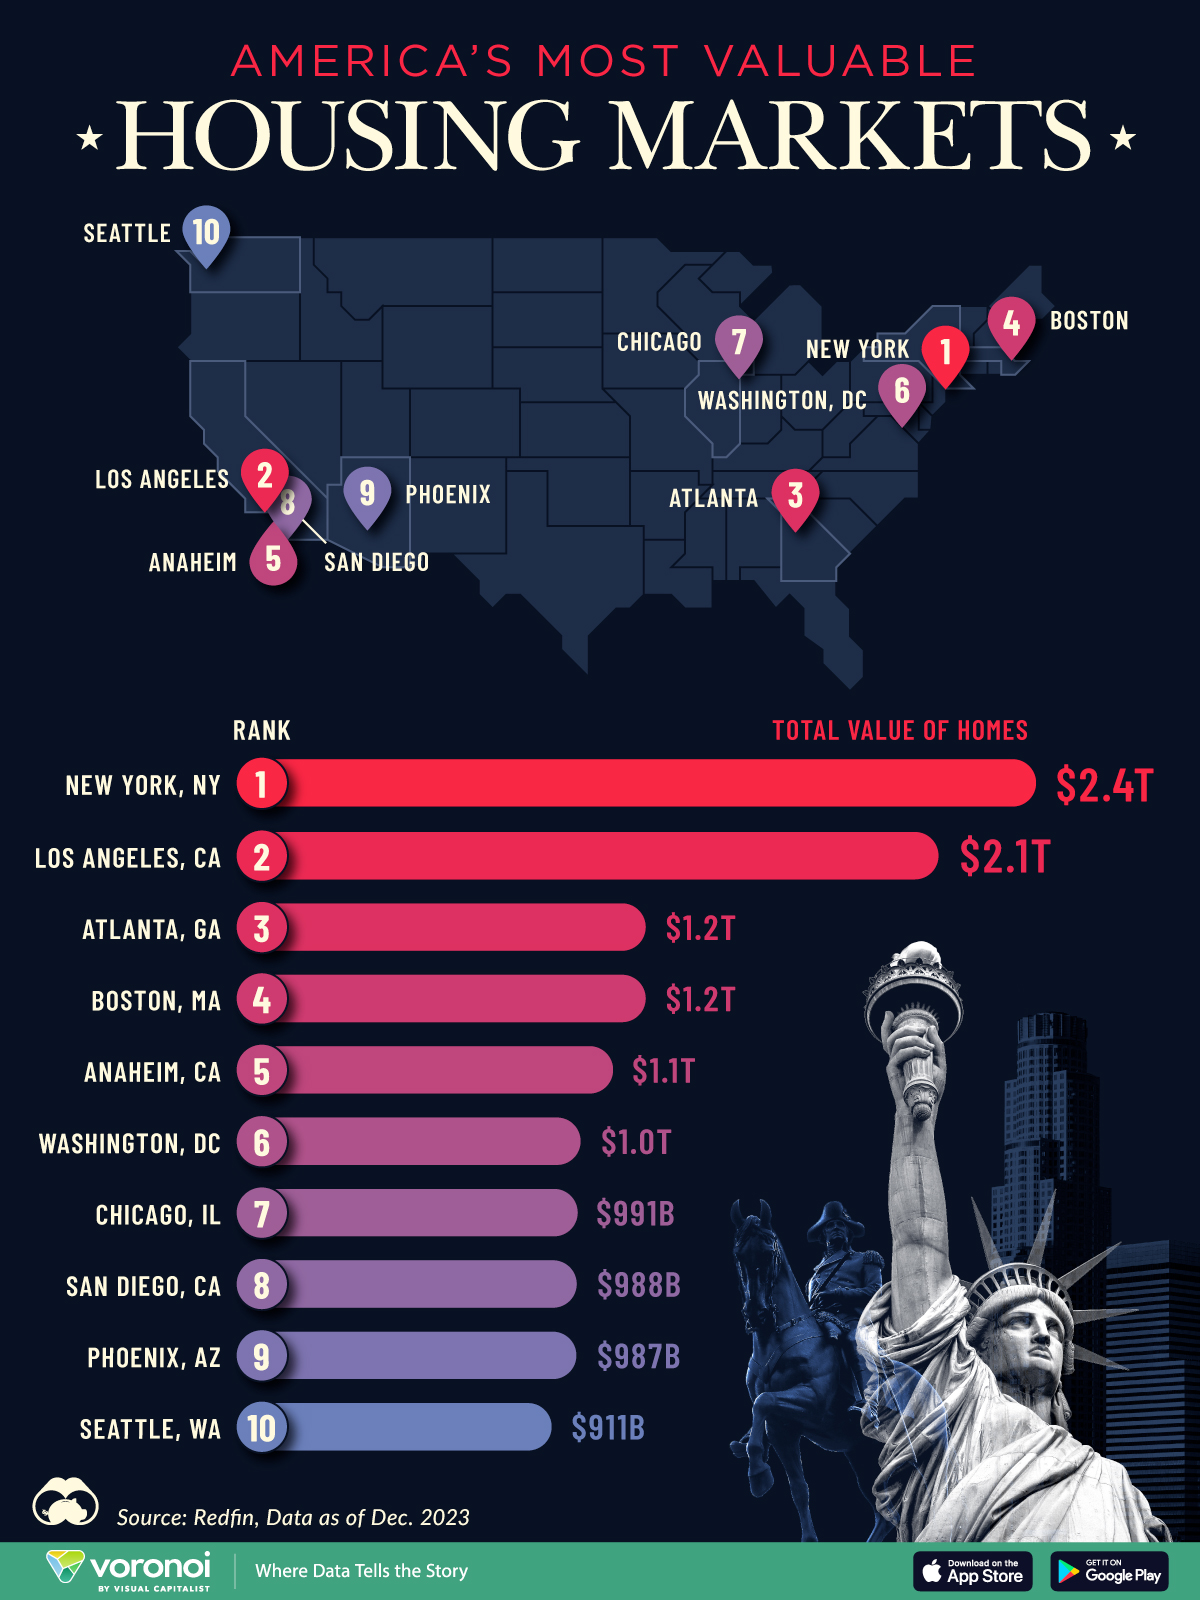
Despite a slowdown in home sales, the total value of homes increased $2.4 trillion last year as low inventory levels pushed up prices. Affordable metropolitan areas saw steady price growth, while expensive metros experienced slower price appreciation.
This graphic shows America’s most valuable housing markets, using data from Redfin.
Top U.S. Residential Real Estate Markets
To calculate the largest U.S. housing markets, Redfin analyzed 90 million properties covering single-family homes, townhouses, condos, and two-to four-unit multifamily properties.
Below, we show the most valuable residential markets as of December 2023:
| Rank | U.S. Metro | Total Value of Homes | Total Value of Homes YoY Change |
|---|---|---|---|
| 1 | New York, NY | $2.4T | -1.0% |
| 2 | Los Angeles, CA | $2.1T | +4.3% |
| 3 | Atlanta, GA | $1.2T | +6.2% |
| 4 | Boston, MA | $1.2T | +8.3% |
| 5 | Anaheim, CA | $1.1T | +8.0% |
| 6 | Washington, DC | $1.0T | +6.2% |
| 7 | Chicago, IL | $991B | +7.4% |
| 8 | San Diego, CA | $988B | +9.4% |
| 9 | Phoenix, AZ | $987B | +4.2% |
| 10 | Seattle, WA | $911B | +4.6% |
With a housing market worth $2.4 trillion, New York, NY tops the list.
Unlike the majority of large U.S. cities, the aggregate value of homes declined as buyers became increasingly priced out of the market. At the same time, homeowners hesitated to sell in order to lock in low mortgage rates. In fact, more than 80% of mortgage holders in New York City have interest rates that are 5% or lower.
Los Angeles, CA falls in second, with a residential real estate market worth $2.0 trillion. Last year, existing home sales tumbled 24.8%, falling to the lowest point since 2007. However, the housing shortage led prices to increase amid high demand. The median sale price climbed to $975,000 in February 2024, a 5.9% jump compared to the same time last year.
Atlanta, GA ranks third and is the most overpriced housing market in the country according to one countrywide analysis. Homes have been selling for 41.7% more than their worth as of the February 2024 data update.
People are flocking to the city for many reasons. General housing affordability is a major driver, along with its thriving tech center. Along with this, state tax credits have increasingly made it a hub for the TV and film industries, earning it the moniker “Y’allywood”. Another factor in Atlanta’s inflating housing market are large investment firms, which own a huge footprint of homes in the city.
Editor’s note: For those wondering about the Bay Area, the data groups cities like San Francisco ($657 billion), San Jose ($821 billion), and Oakland ($881 billion) as individual entities, which puts them outside the cutoff. See the Redfin data for the full list of cities.
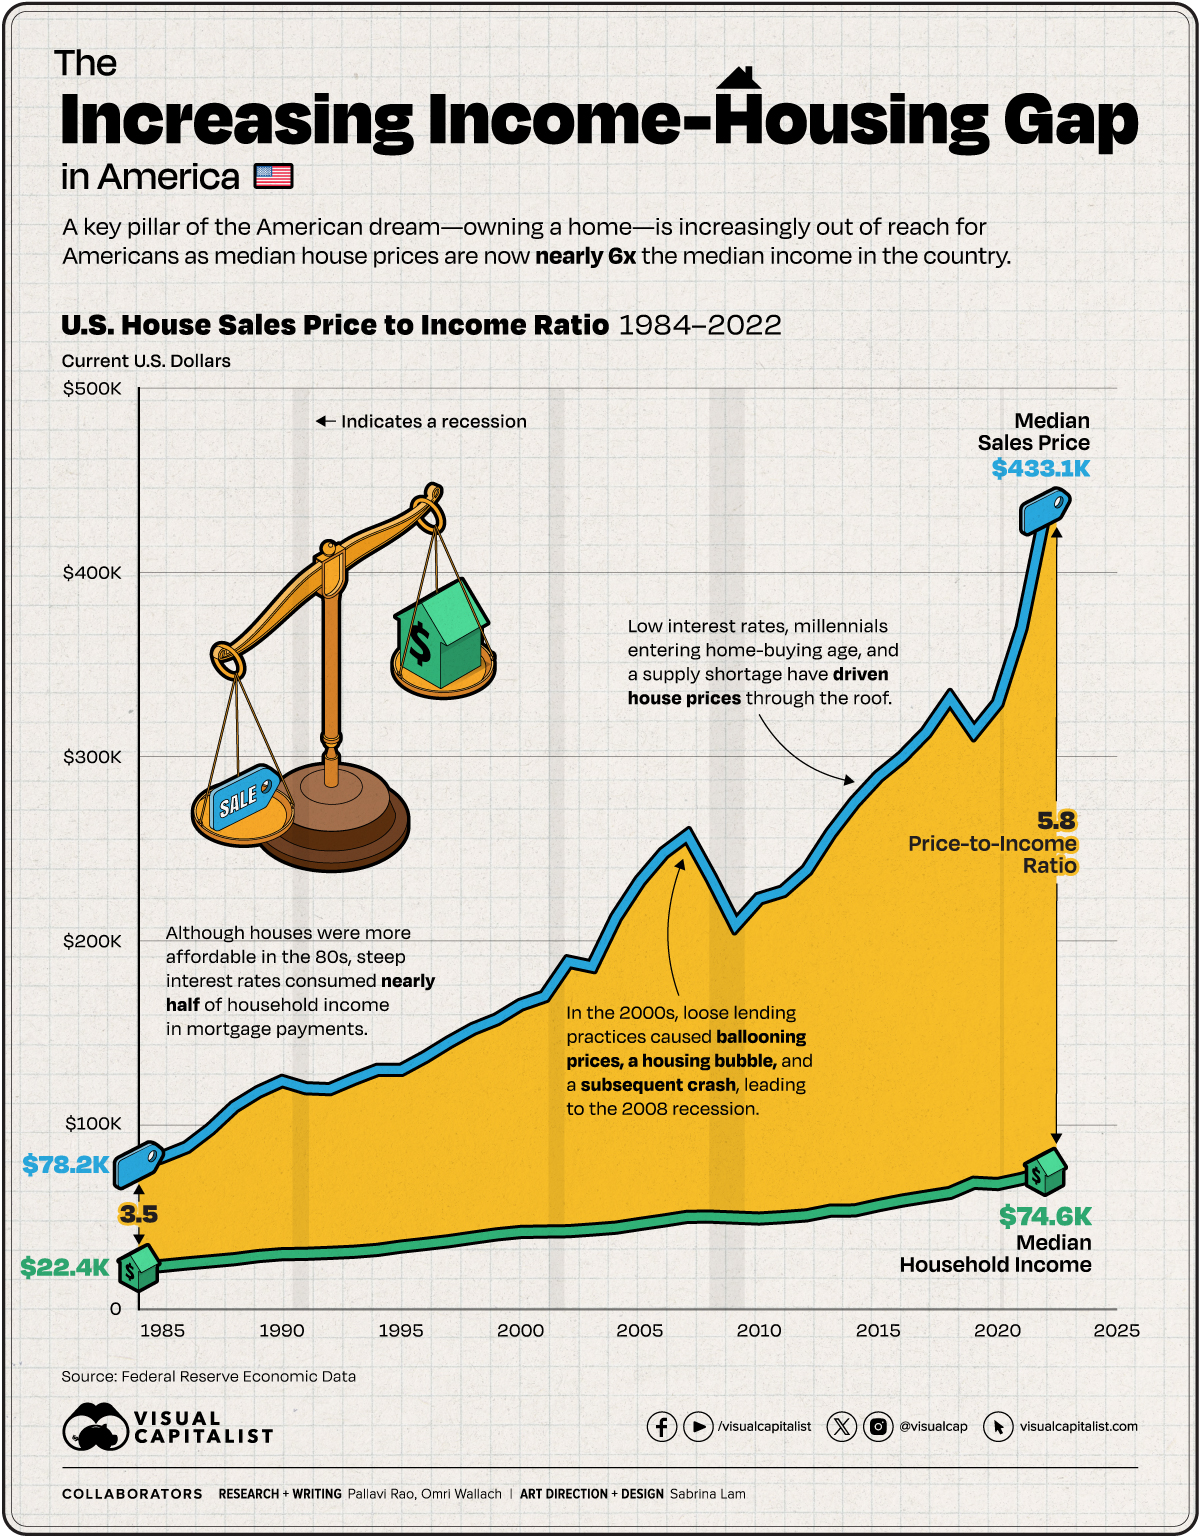 Houses in America Now Cost
6x
Median Income
As of 2023, an American household hoping to buy a median-priced home, needs to make at least $100,000 a year.
In some cities, they need to make nearly 3–4x that amount.
The median household income in the country is currently well below that $100,000 threshold. To look at the trends between median incomes and median house prices through the years, we charted their movement using the following datasets data from the Federal Reserve:
- Median household income (1984–2022).
- Median Sales Price of Houses Sold (1963–2023).
Importantly this graphic does not make allowances for actual household disposable income, nor how monthly mortgage payments change depending on the interest rates at the time. Finally, both datasets are in current U.S. dollars, meaning they are not adjusted for inflation.
Timeline: Median House Prices vs. Income in America
In 1984, the median annual income for an American household stood at $22,420, and the median house sales price for the first quarter of the year came in at $78,200. The house sales price-to-income ratio stood at 3.49.
By pure arithmetic, this is the most affordable houses have been in the U.S. since the Federal Reserve began tracking this data, as seen in the table below.
A hidden caveat of course, was inflation: running rampant towards the end of the 70s and the start of the 80s. While it fell significantly in the next five years, in 1984 the 30-year fixed rate was close to 14%, meaning a significant chunk of household income went to interest payments.
| Date | Median Sales Price | Median Household income | Price-to-Income Ratio |
|---|---|---|---|
| 1984-01-01 | $78,200 | $22,420 | 3.49 |
| 1985-01-01 | $82,800 | $23,620 | 3.51 |
| 1986-01-01 | $88,000 | $24,900 | 3.53 |
| 1987-01-01 | $97,900 | $26,060 | 3.76 |
| 1988-01-01 | $110,000 | $27,230 | 4.04 |
| 1989-01-01 | $118,000 | $28,910 | 4.08 |
| 1990-01-01 | $123,900 | $29,940 | 4.14 |
| 1991-01-01 | $120,000 | $30,130 | 3.98 |
| 1992-01-01 | $119,500 | $30,640 | 3.90 |
| 1993-01-01 | $125,000 | $31,240 | 4.00 |
Note: The median house sale price listed in this table and in the chart is from the first quarter of each year. As a result the ratio can vary between quarters of each year.
The mid-2000s witnessed an explosive surge in home prices, eventually culminating in a housing bubble and subsequent crash—an influential factor in the 2008 recession. Subprime mortgages played a pivotal role in this scenario, as they were issued to buyers with poor credit and then bundled into seemingly more attractive securities for financial institutions. However, these loans eventually faltered as economic circumstances changed.
In response to the recession and to stimulate economic demand, the Federal Reserve reduced interest rates, consequently lowering mortgage rates.
While this measure aimed to make homeownership more accessible, it also contributed to a significant increase in housing prices in the following years. Additionally, a new generation entering the home-buying market heightened demand. Simultaneously, a scarcity of new construction and a surge in investors and corporations converting housing units into rental properties led to a shortage in supply, exerting upward pressure on prices.
As a result, median house prices are now nearly 6x the median household income in America.
How Does Unaffordable Housing Affect the U.S. Economy?
When housing costs exceed a significant portion of household income, families are forced to cut back on other essential expenditures, dampening consumer spending. Given how expanding housing supply helped drive U.S. economic growth in the 20th century, the current constraints in the country are especially ironic.
Unaffordable housing also stifles mobility, as individuals may be reluctant to relocate for better job opportunities due to housing constraints.
On the flip side, many cities are seeing severe labor shortages as many lower-wage workers simply cannot afford to live in the city. Both phenomena affect market efficiency and productivity growth.
Fastest Rising U.S. Housing Markets 2024
U.S. housing market has been on a tear; median sales prices rising more than 40% since FEB 2020.
While cities in southern states like Florida have witnessed some of the strongest price growth, more affordable cities across the Midwest are also seeing growing demand as buyers seek out cheaper options. This graphic shows the U.S. metros with the fastest price growth, based on data from Redfin.
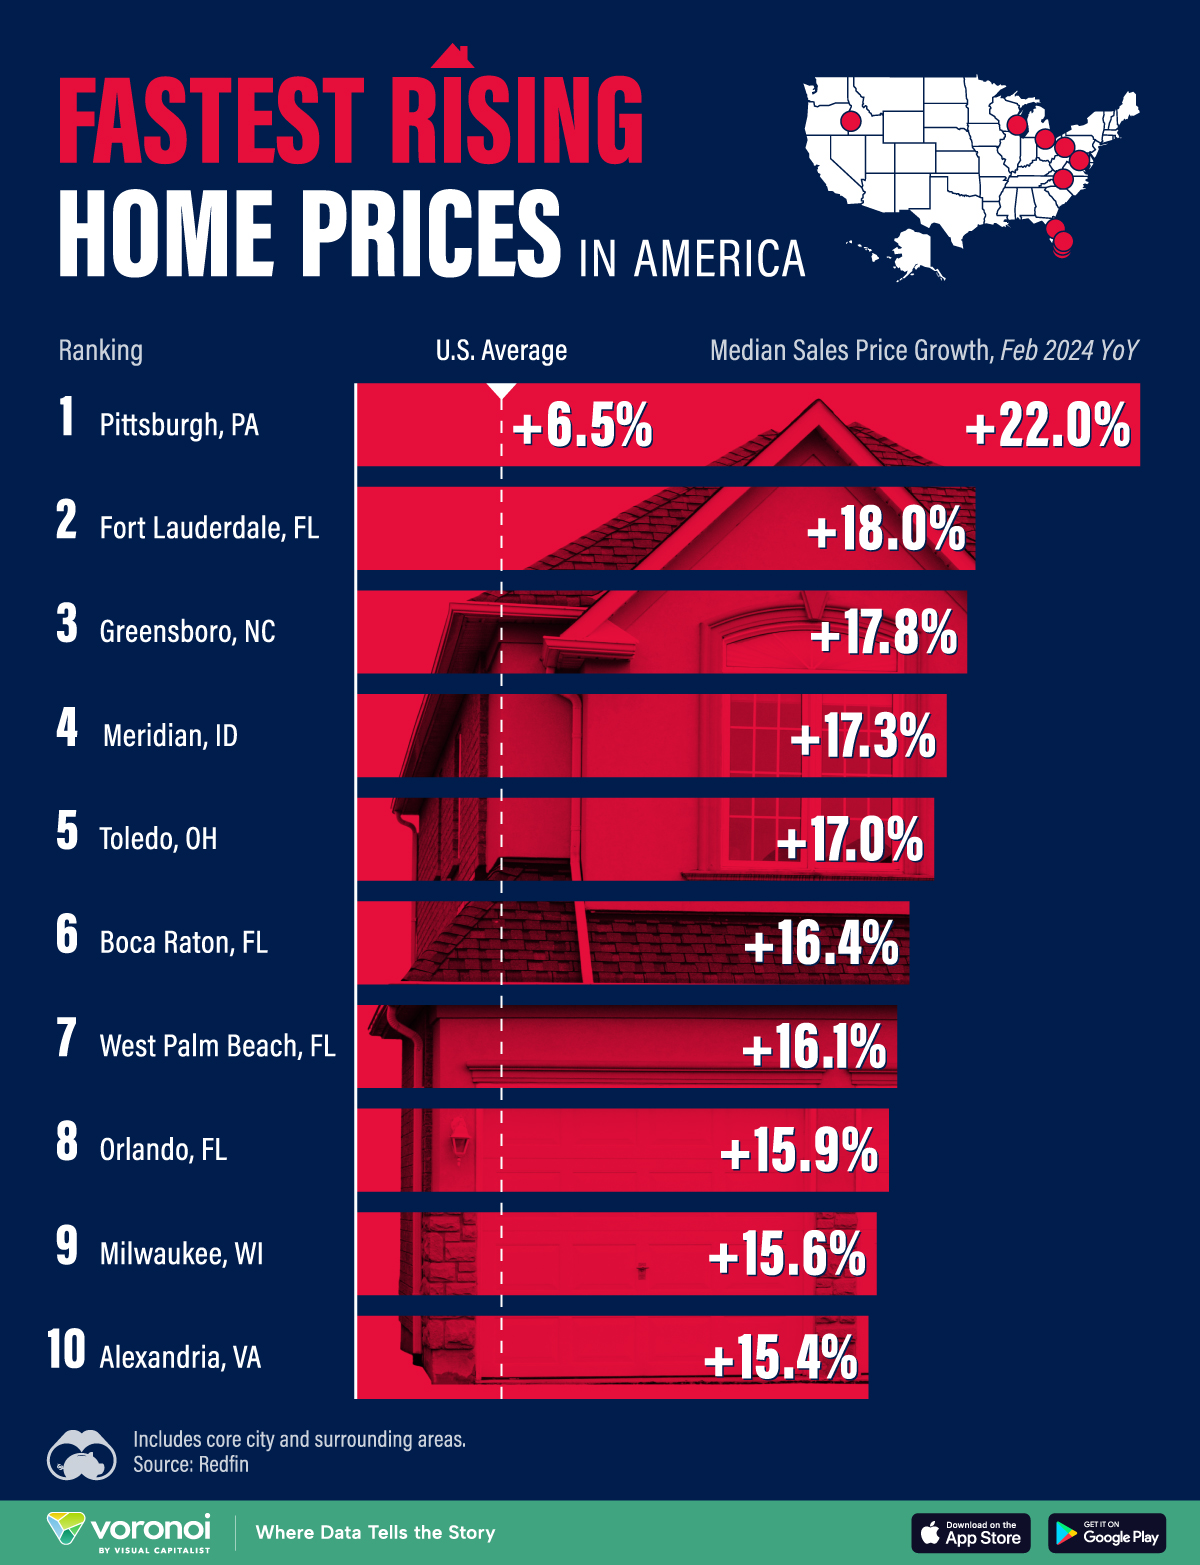
Hottest Housing Markets in America
Ranking metro areas; fastest annual median sales price growth as of FEB 2024:
| Rank | Metro | Median Sales Price Growth
Feb 2024 YoY |
|---|---|---|
| 1 | Pittsburgh, PA | +22.0% |
| 2 | Fort Lauderdale, FL | +18.0% |
| 3 | Greensboro, NC | +17.8% |
| 4 | Meridian, ID | +17.3% |
| 5 | Toledo, OH | +17.0% |
| 6 | Boca Raton, FL | +16.4% |
| 7 | West Palm Beach, FL | +16.1% |
| 8 | Orlando, FL | +15.9% |
| 9 | Milwaukee, WI | +15.6% |
| 10 | Alexandria, VA | +15.4% |
| U.S. average | +6.5% |
Pittsburgh, PA soars to the top of the list, with median sale prices jumping 22% over the year.
Once known as a center for steel and iron manufacturing, the city has emerged as a hub for high-tech industries including robotics, software engineering, and healthcare.
At a time when housing affordability is near record lows, buyers have flocked to the market thanks to its lower home prices.
In February, median sales prices in Pittsburgh were $250,000 compared to the U.S. median price of $412,219.
Following next in line is Fort Lauderdale, FL with prices jumping 18% annually.
Like several cities across the state, property values have boomed thanks to the state’s warm climate and low taxes. The state also ranks as one of the best in the country to retire.
In 2023, it was one of the fastest growing states in the country, adding 365,205 residents overall.
As we can see, just one housing market in the West, Meridian, ID, is experiencing some of the strongest price growth in the country.
Since the pandemic, many Californians priced out of expensive real estate markets have moved to the state due to its strong job market, low crime rate, and affordability.
In fact, Los Angeles and San Francisco are some of the top metropolitan areas nationally that people are moving away from due to remote-work trends and the high cost of living.
![]() CONTINUING
CONTINUING
PROFESSISONAL EDUCATION
& NETWORKING
SCANDINAVIA GLOBALHR BUSINESS TALENT
26 SEPTEMBER
MALMO SWEDEN / METRO COPENHAGEN
QUALITY VIEW hotel/conference center – Malmo
Luncheon & Workshop now developing

get info publisher@globalbusiness.media
GLOBAL BUSINESS TALENT FOR GLOBAL TRADE
LONDON 1 OCTOBER
![]()


now developing
get info publisher@globalbusiness.media
AUDIENCE via LinkedIn
296,687 audience views / impressions across 12 months
+ 803 % over the previous year… !
TO LIFE !
watch it
1, 1:1 MEHIBE HILL in Barcelona: COURAGE + Impostor Syndrome
2, A I and medical science research; Parkinson’s talk with patients
3, Dr. Natalie speaks about MINDSET; Defining it … How-To-Get-It
4, Dianne Devitt 1:1 Travel Safely! Here’s what happened to me
6, Parkinson’s + ALS + additional neuro afflictions
7, National StemCell Foundation’s Dr. Paula Grisanti and others discuss medical science research
8, REMEDIUM BIO on gene therapy
9, Dr. Simon T. Bailey, author/speaker on “self-help”; simontbailey.com
10, Emiliana Borrelli; Knight in the Order of the “Légion d’Honneur”
TO LIFE !
Be a cosponsor of the series
June thru December 2024….
Total cost to you $495.
Be a speaker on each program thru Christmas;
be introduced to business leaders and top thinkers;
Display logo-link on each program’s website… receive global PR
Display your logo-link on GlobalBusinessNews.net now thru Christmas;
… you will reap the benefits, mental, physical, financial
… gain from the positive and long-term Global PR and business exposure.
nonstop Global PR 365/7-24 … contact Ed publisher@globalbusiness.media
AND WE THANK YOU FOR YOUR KIND CONSIDERATION
GlobalBusinessTV ..click, see what’s on
click logo to read all about it… learn more about the THANK YOU GIFTS that all members receive each month of their subscription/membership