
What we’re showing
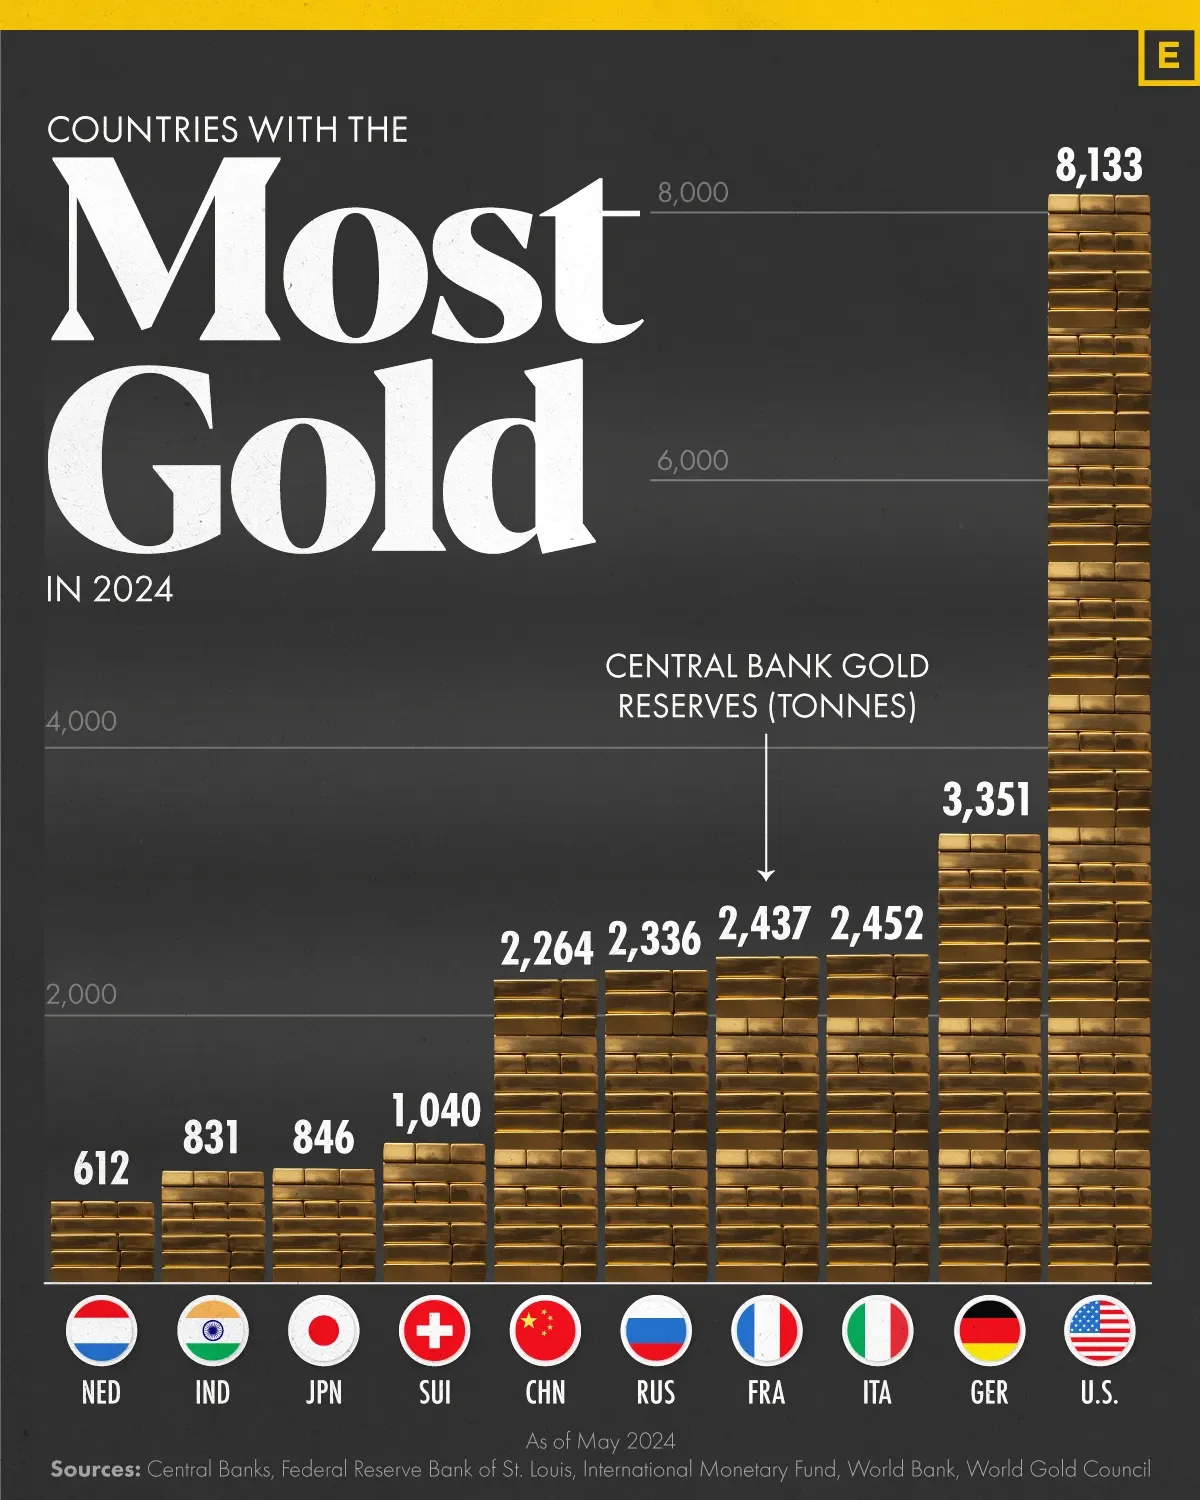
The top ten countries in total gold reserves (tonnes) as of May 2024. These figures come from the World Gold Council.
Gold Reserves
- Central banks hold gold reserves due to their safety, liquidity, and return characteristics. They are significant owners of gold, accounting for approximately a fifth of all the gold mined throughout history.
- The country with the most gold is the United States, with 8,133 tonnes, which has a value of $579 billion.
Dataset
| Rank | Country/Organization | Tonnes |
|---|---|---|
| 1 | 🇺🇸 United States | 8,133 |
| 2 | 🇩🇪 Germany | 3,351 |
| 3 | 🇮🇹 Italy | 2,452 |
| 4 | 🇫🇷 France | 2,437 |
| 5 | 🇷🇺 Russia | 2,336 |
| 6 | 🇨🇳 China | 2,264 |
| 7 | 🇨🇭 Switzerland | 1,040 |
| 8 | 🇯🇵 Japan | 846 |
| 9 | 🇮🇳 India | 831 |
| 10 | 🇳🇱 Netherlands | 612 |
Click here to add your own text
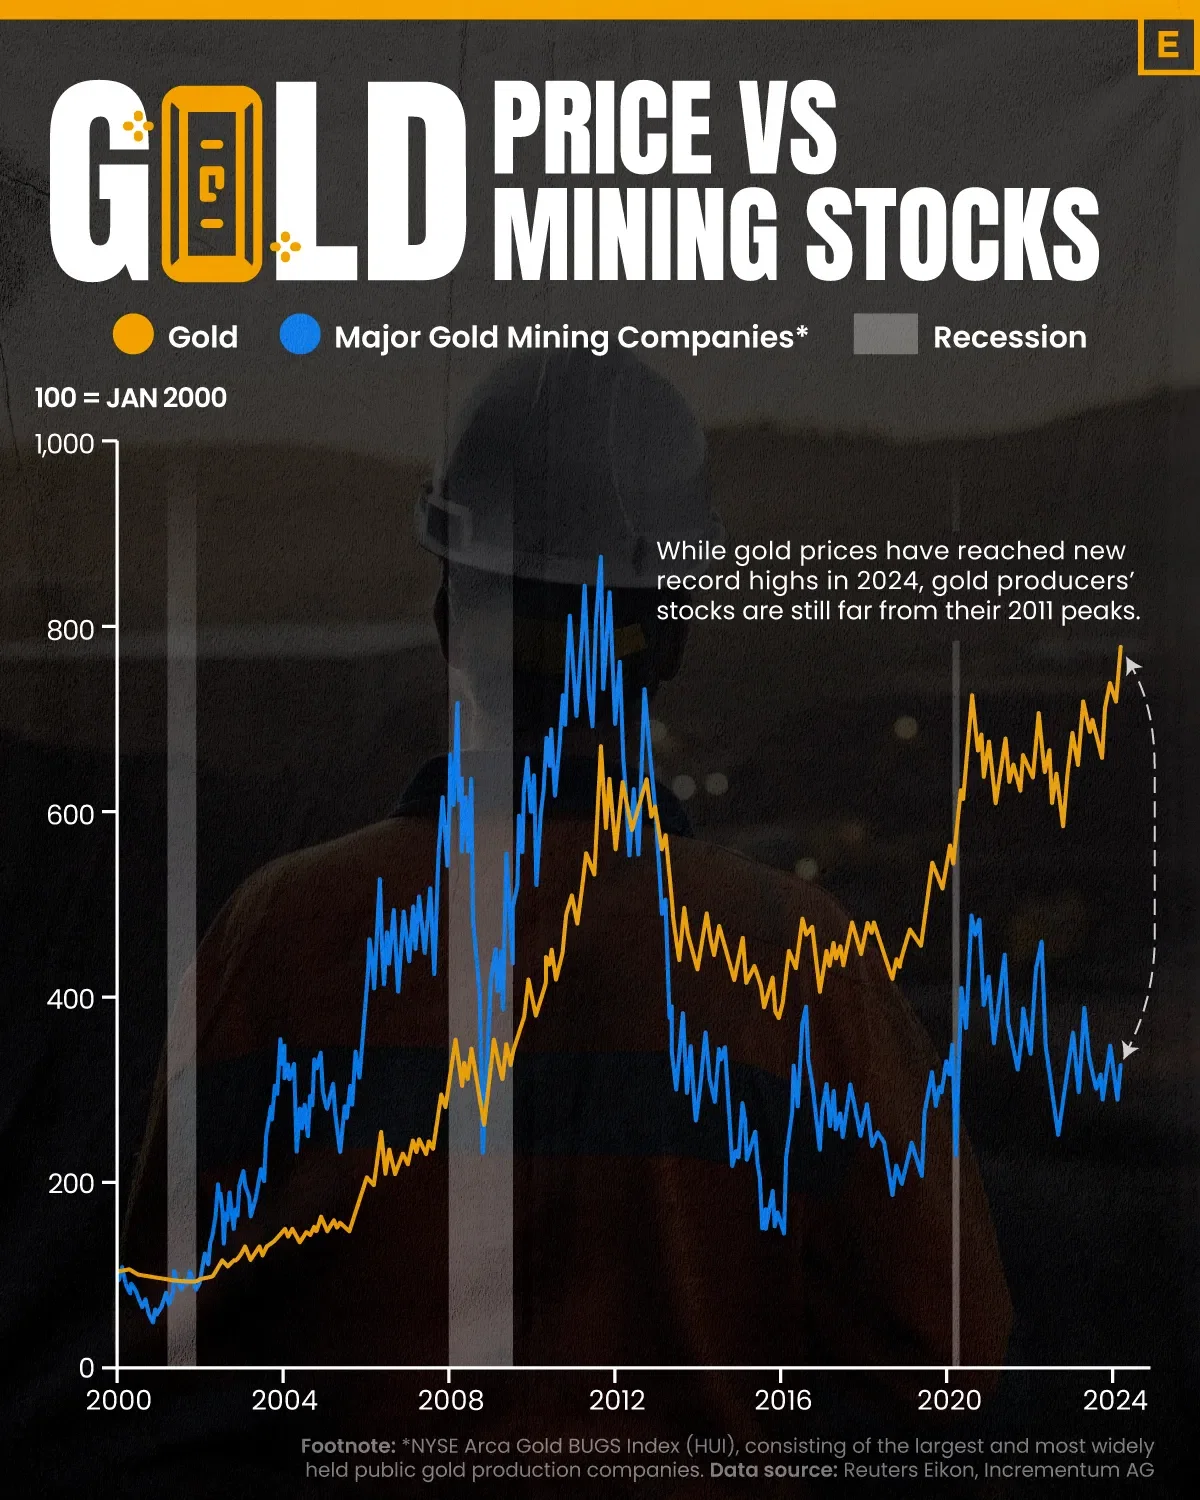
What we’re showing?
Gold price evolution since 2000 compared to the NYSE Arca Gold BUGS Index (HUI), consisting of the largest and most widely held public gold production companies.
Key Takeaway
While gold price has reached new record highs in 2024, miners are still a long way
from their 2011 highs.
Furthermore, with elections occurring in more than 60 countries in 2024 and ongoing conflicts in Ukraine and Gaza, central banks are expected to continue buying gold to strengthen their reserves, which could build momentum for gold mining stocks.
According to Business Insider, gold miners experienced their best performance in a year in March 2024.
Dataset
| Year | Gold Price | NYSE Arca Gold BUGS Index (HUI) |
|---|---|---|
| 2023 | $2,062.92 | $243.31 |
| 2022 | $1,824.32 | $229.75 |
| 2021 | $1,828.60 | $258.87 |
| 2020 | $1,895.10 | $299.64 |
| 2019 | $1,523.00 | $241.94 |
| 2018 | $1,281.65 | $160.58 |
| 2017 | $1,296.50 | $192.31 |
| 2016 | $1,151.70 | $182.31 |
| 2015 | $1,060.20 | $111.18 |
| 2014 | $1,199.25 | $164.03 |
| 2013 | $1,201.50 | $197.70 |
| 2012 | $1,664.00 | $444.22 |
| 2011 | $1,574.50 | $498.73 |
| 2010 | $1,410.25 | $573.32 |
| 2009 | $1,104.00 | $429.91 |
| 2008 | $865.00 | $302.41 |
| 2007 | $836.50 | $409.37 |
| 2006 | $635.70 | $338.24 |
| 2005 | $513.00 | $276.90 |
| 2004 | $438.00 | $215.33 |
| 2003 | $417.25 | $242.93 |
| 2002 | $342.75 | $145.12 |
| 2001 | $276.50 | $65.20 |
| 2000 | $272.65 | $40.97 |
Data sources
Gold and stock prices are as of December of each year.
Click here to add your own text