
In many major cities, real home prices have declined as high interest rates are dampening demand.
Simultaneously, property markets are slowing due to tough financing conditions and rising construction costs. As a result, housing bubble risks have eased in cities like Hong Kong, London, and New York. However, strong demand in the luxury market and a booming stock market are fueling bubble risks in cities like Miami and Los Angeles.
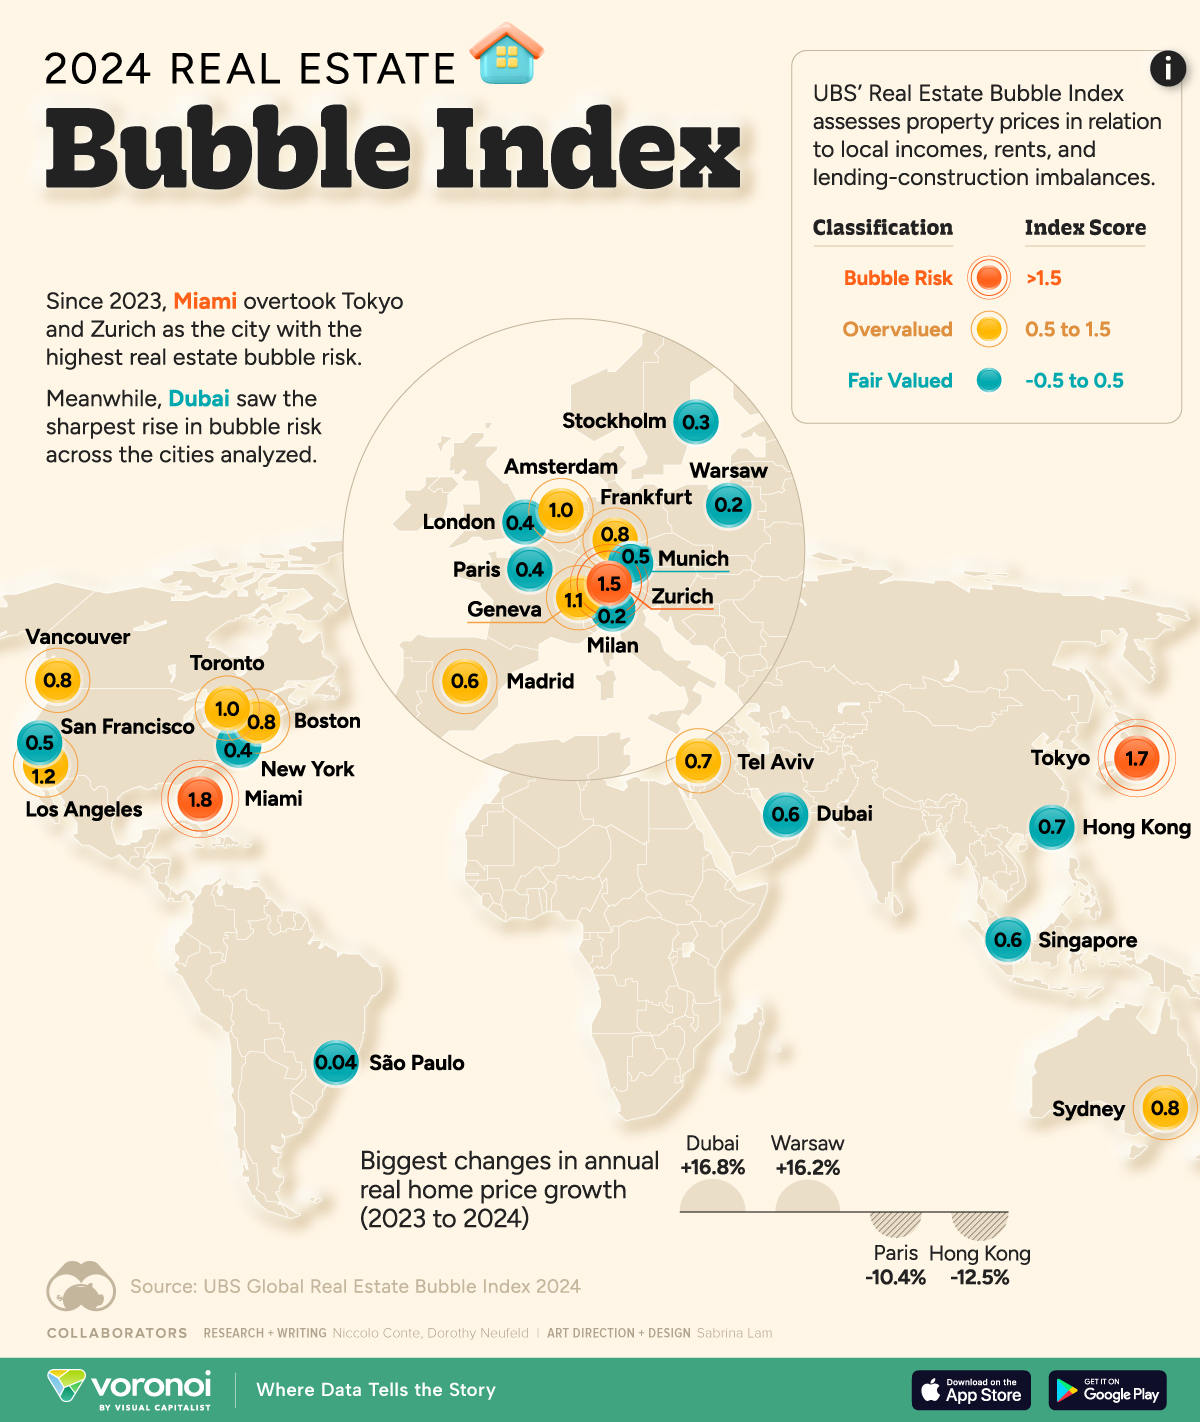
This graphic shows the cities with the highest real estate bubble risk, based on the UBS Global Real Estate Bubble Index 2024.
Methodology
To analyze real estate bubble risk, UBS looked at the following factors across 25 major cities:
- Price-to-income ratio
- Price-to-rent ratio
- Change in mortgage-to-GDP ratio
- Change in construction-to-GDP ratio
- City-to-country price ratio
More specifically, bubble risk refers to the likelihood of a significant price correction due to distortions in global property markets
Miami Ranks Highest for Housing Bubble Risk
With real housing prices increasing nearly 50% since the end of 2019, Miami has the highest bubble risk across cities analyzed.
This has pushed the price-to-income ratio higher, as buyers compete for limited waterfront luxury properties. At the same time, the city’s relative affordability compared to other major U.S. metros, along with no state income tax and a favorable climate, has fueled demand.
Ranking in second is Tokyo, one of the most unaffordable cities in the world.
Ultra-loose monetary policy and economic stability has contributed to high property valuations in Tokyo. Last year, a 646 square foot apartment cost 15 times more than an average skilled worker’s salary, exceeding levels seen in London and New York.
Although Dubai hasn’t entered bubble territory, home prices surged 17% between Q2 2023 and Q2 2024—the fastest increase among the cities analyzed. Over the past year, the city saw record transaction volumes and strong population growth as buyers flocked to this global financial hub.
By contrast, a number of cities saw their bubble risk decline as real home values dropped, including London, Hong Kong, Paris, and Toronto.
Click here to add your own text
Many Americans continue to find homeownership financially out of reach due to rising house prices and stagnant wages, among other contributing factors. But which U.S. cities are the least affordable?
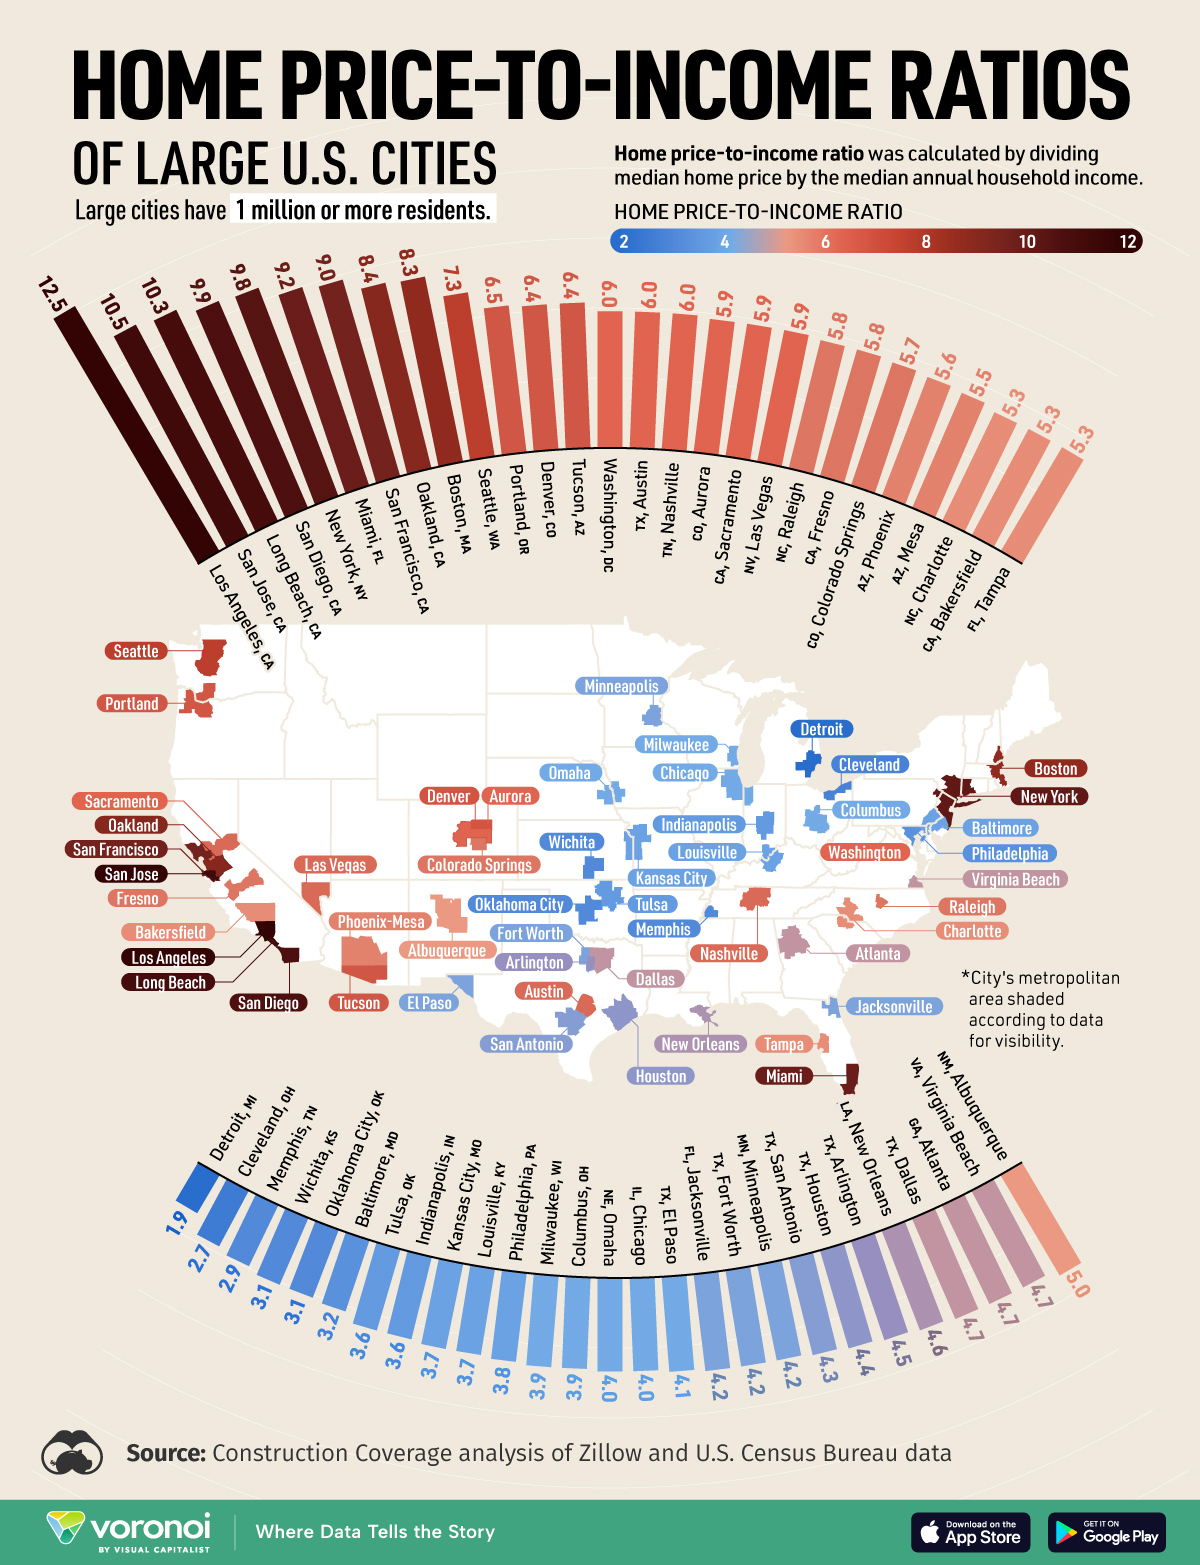
One way to assess housing affordability is through the home price-to-income ratio, which measures the ratio of the median home price to the median household income.
This map shows the home price-to-income ratio of 54 large cities (population over one million) in the U.S. using data from Construction Coverage’s analysis of Zillow and U.S. Census Bureau data.
Housing Affordability Worst in Coastal U.S. Cities
Below, we show the home price-to-income ratio, median home price, and median household income.
Cities on the West Coast, particularly in California, face the most significant housing affordability challenges.
The top four cities with the highest ratios are all in California, while other major West Coast cities like San Francisco, Seattle, and Portland rank among the top 15.
The top five cities, including New York City, have a home price-to-income ratio more than double the national average of 4.7, making them highly unaffordable.
While median household income in cities like San Francisco, San Jose, and Seattle are among the highest in the country, they also have some of the most expensive house prices in the country.
The Midwest and parts of the South have much lower ratios, including Detroit (1.9), Cleveland (2.1), and Memphis (3.1). Midwest cities consistently rank among the most affordable for housing and cost of living.